Mortgage Origination in a Post-COVID-19 World
In this blog post, we used the recently updated Mortgage Market Statistical Annual to examine the dynamics of residential loan origination by state and by market segments and highlight important trends.
From mid-2020 until April 2022, the Fed Funds rate was zero and fixed rate mortgage rates were historically low at about 3% (see Figure 1). Thereafter, the Fed began raising the Fed Funds rate to 5% today and fixed rate mortgage rates have doubled. Mortgage payments became unaffordable to many potential buyers and the mortgage origination volume dropped drastically across market segments and states by 80%. Predictably, the refinance market disappeared. Figure 2 shows that the origination volume for different mortgage products decreased drastically from Q1 2021 to 2023.
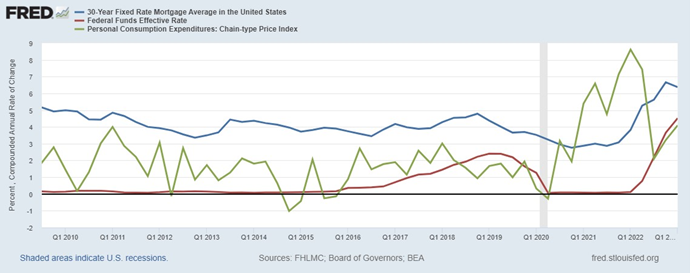
Figure 1. 30-Year Mortgage Rate, Fed Funds Effective Rate and PCE Price Index
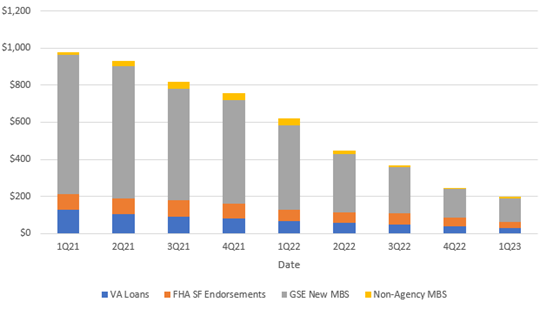
Figure 2. Origination Volume by Market Composition (Dollars in Billions)
Homeowners with low-rate mortgages have a strong financial incentive not to sell when facing the prospect of buying a new house with a mortgage rate twice as high (lock-in effect). These homeowners on the sidelines reduce both the supply and demand for housing. The countervailing impacts on price make the ultimate effect unclear; prices could rise or fall, but the changes are likely to moderate.
Figure 3 shows two things; (1) the housing price spike during the pandemic when rates were so low and the predicted recent collapse when rates rose and (2) turning points in housing prices lead to turning points in new construction rates weighted by population.
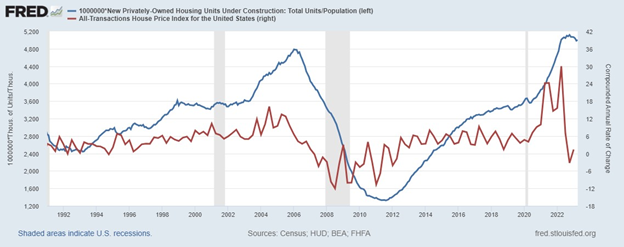
Figure 3. Housing Units Under Construction vs HPI
Looking at the States
Across the 50 states, plus Washington D.C. and Puerto Rico, origination dropped 48% from 2021 to 2022. For some background, YoY changes for the past few months have been positive, with 2019 to 2020 year-over-year (YoY) showing a 78% increase. We have to go back to 2016 to 2017 to see a negative 10% YoY drop and 2017 to 2018 a negative 9% drop. Among the most populous states, California suffered the largest drop YoY, declining by a whopping 60%. Some other states with a big YoY drop in origination include Maryland, 55%, Virginia, 54% and Massachusetts, 53%. On the other end, Texas and Florida had the smallest YoY losses at around 33%.
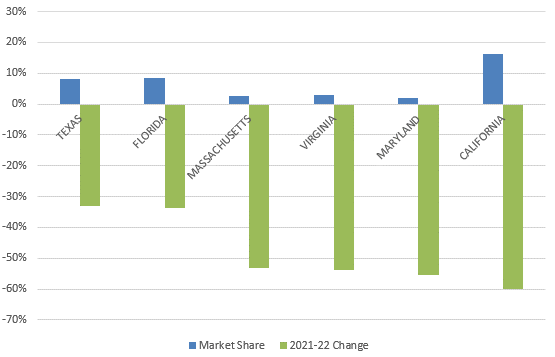
Figure 4 Originations by State
The situation in California, the most expensive state with the most expensive housing market was obvious; the escalating rate hikes priced many potential buyers out of the housing market in a state already hurt by the high income and property taxes.
The situations in Florida and Texas were drastically different. As low tax states, they represented good buying options even in a severe market turn and suffered the least drops.
Naturally, people are motivated to move to more tax-friendly states such as Florida when they retire. As the global pandemic hit and changed how people live and work, it further amplified that migration trend. Workers who once needed to live in states with hot employment markets like California’s tech hub can now work remotely and leave for other lower-cost states.
From Refinance to Purchase
The ten consecutive Fed rate hikes eliminated the refinance boom and deterred existing borrowers from moving, a combination leading to the plunge of origination. The refinance share has fallen from 71% in Q1 2021 to 16% in Q4 2022. On the turnover side, purchasing activities are still ongoing amidst the high rate environment. Purchase volume is not as drastically changed but still has fallen 13% from 2021. Figure 3 still shows a very steady volume of purchase originations over the past two years, despite its obvious decline over the past months. The decrease of the purchase volume can be attributed to the “lock in effect.”[1] The lock in effect is visible for discount mortgages as it deters potential sellers from giving up their current low-rate loan and finance next property with a more expensive one even if they have plans to relocate.
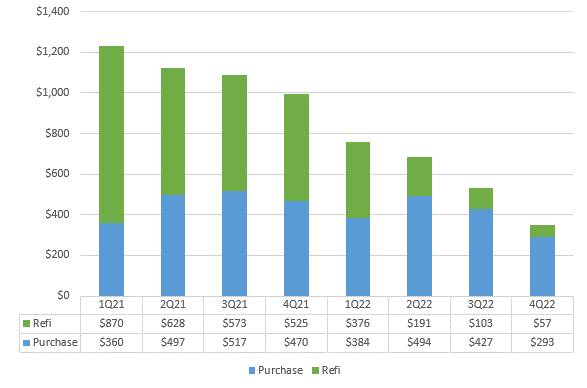
Figure 5. Purchase vs Refi Origination Volume (Dollars in Billions)
Looking Forward
We will continue to monitor changes in origination trends and their connection with affordability and home prices in our borrower behavior and home price modeling. For additional insight, read AD&Co’s HPI Outlook Update by Alex Levin.[2]