

Welcome to The S-Curve
Now you will be able to receive the latest announcements, product updates, and our insights on the mortgage market in real time.
The name of the blog, the S-Curve, is a reflection of our logo and the central feature of our prepayment model. S-curves are seen in nature in many phenomenon, from population growth to prepayment and default models. Our first S-curve, in the early 1990s, used the arctangent function, then piece-wise linear functions, and evolved over time to be more complex and vary by FICO, loan size and LTV. This evolution encapsulates both the timeless nature of fundamental relationships and constant innovation to describe them better over time.
We hope you find the information useful and we look forward to your feedback.
-
 Mortgage Origination in a Post-COVID-19 WorldThoughts
In this blog post, we used the recently updated Mortgage Market Statistical Annual to examine the dynamics of residential loan origination by state and by market segments and highlight important trends.
From mid-2020 until April 2022, the Fed Funds rate was zero and fixed rate mortgage rates were historically low at about 3% (see Figure 1). Thereafter, the Fed began raising the Fed Funds rate to 5% today and fixed rate mortgage rates have doubled. Mortgage payments became unaffordable to many potential buyers and the mortgage origination volume dropped drastically across market segments and states by 80%. Predictably, the refinance market disappeared. Figure 2 shows that the origination volume for different mortgage products decreased drastically from Q1 2021 to 2023.
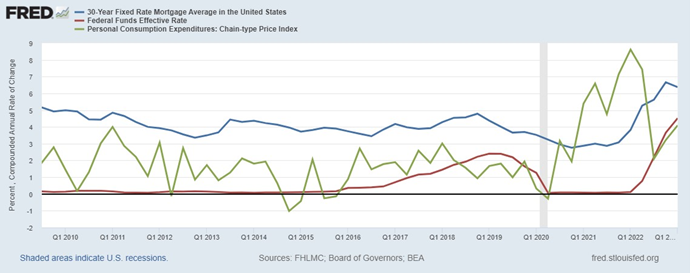
Figure 1. 30-Year Mortgage Rate, Fed Funds Effective Rate and PCE Price Index
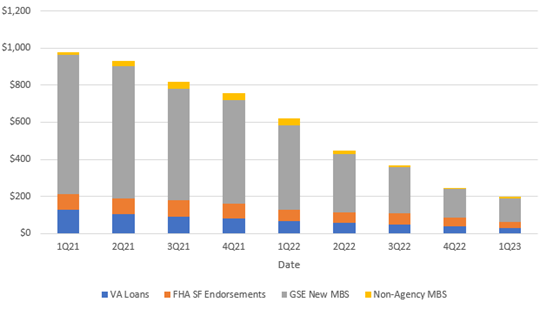
Figure 2. Origination Volume by Market Composition (Dollars in Billions)
Homeowners with low-rate mortgages have a strong financial incentive not to sell when facing the prospect of buying a new house with a mortgage rate twice as high (lock-in effect). These homeowners on the sidelines reduce both the supply and demand for housing. The countervailing impacts on price make the ultimate effect unclear; prices could rise or fall, but the changes are likely to moderate.
Figure 3 shows two things; (1) the housing price spike during the pandemic when rates were so low and the predicted recent collapse when rates rose and (2) turning points in housing prices lead to turning points in new construction rates weighted by population.
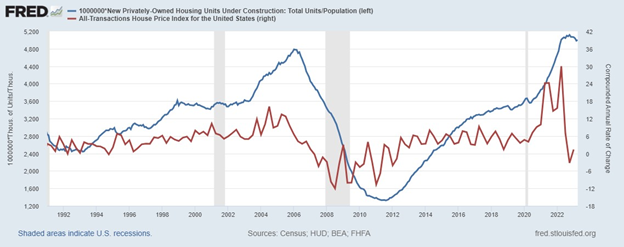
Figure 3. Housing Units Under Construction vs HPI
Looking at the States
Across the 50 states, plus Washington D.C. and Puerto Rico, origination dropped 48% from 2021 to 2022. For some background, YoY changes for the past few months have been positive, with 2019 to 2020 year-over-year (YoY) showing a 78% increase. We have to go back to 2016 to 2017 to see a negative 10% YoY drop and 2017 to 2018 a negative 9% drop. Among the most populous states, California suffered the largest drop YoY, declining by a whopping 60%. Some other states with a big YoY drop in origination include Maryland, 55%, Virginia, 54% and Massachusetts, 53%. On the other end, Texas and Florida had the smallest YoY losses at around 33%.
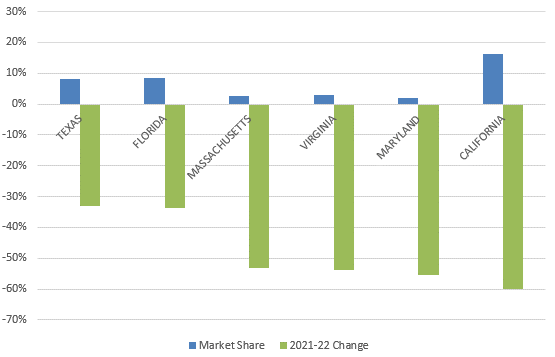
Figure 4 Originations by State
The situation in California, the most expensive state with the most expensive housing market was obvious; the escalating rate hikes priced many potential buyers out of the housing market in a state already hurt by the high income and property taxes.
The situations in Florida and Texas were drastically different. As low tax states, they represented good buying options even in a severe market turn and suffered the least drops.
Naturally, people are motivated to move to more tax-friendly states such as Florida when they retire. As the global pandemic hit and changed how people live and work, it further amplified that migration trend. Workers who once needed to live in states with hot employment markets like California’s tech hub can now work remotely and leave for other lower-cost states.
From Refinance to Purchase
The ten consecutive Fed rate hikes eliminated the refinance boom and deterred existing borrowers from moving, a combination leading to the plunge of origination. The refinance share has fallen from 71% in Q1 2021 to 16% in Q4 2022. On the turnover side, purchasing activities are still ongoing amidst the high rate environment. Purchase volume is not as drastically changed but still has fallen 13% from 2021. Figure 3 still shows a very steady volume of purchase originations over the past two years, despite its obvious decline over the past months. The decrease of the purchase volume can be attributed to the “lock in effect.”[1] The lock in effect is visible for discount mortgages as it deters potential sellers from giving up their current low-rate loan and finance next property with a more expensive one even if they have plans to relocate.
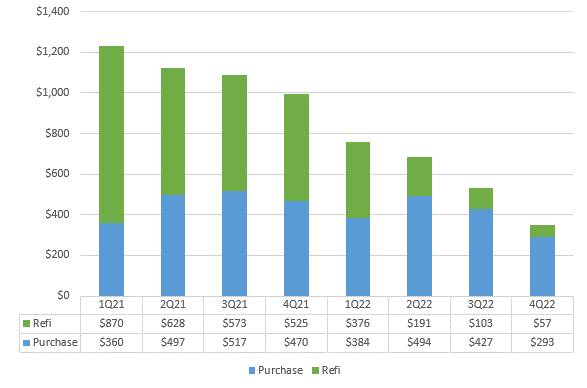
Figure 5. Purchase vs Refi Origination Volume (Dollars in Billions)
Looking Forward
We will continue to monitor changes in origination trends and their connection with affordability and home prices in our borrower behavior and home price modeling. For additional insight, read AD&Co’s HPI Outlook Update by Alex Levin.[2]
[1] Baker, Joni, and Daniel Swanson. “How to Use AD&Co’s Deep Discount and Super Premium S-Curve Tuning.” Quantitative Perspectives (May 2023).
[2] Levin, Alex. “AD&Co’S HPI Outlook Update: Flat, But Multidirectional.” The Pipeline, no. 182 (June 2023).
The S-Curve Archives
-
Thoughts
Summary
In 2021, Andrew Davidson & Co. Inc. (AD&Co) proposed a benchmark cohort approach to setting Ability-to-Repay (ATR) Qualified Mortgages (QM) standards. Successful benchmarks based on data are model-free and transparent, and the cohorts must perform consistently in comparison to one another and across time. Our original work used data through the early stages of the pandemic when non-performing loan percentages skyrocketed.
-
 Thoughts
How Lowering Capital Costs Affects Higher-Risk Loans
Government-sponsored enterprises (or GSEs) are companies that provide guarantees and financing to originators through the mortgage secondary market. The size and resilience of the GSE secondary market maximizes diversification and liquidity which reduces financial risk and cost of capital. This benefit accrues to conforming borrowers through lower mortgage rates and resiliently available financing.
-
 Products
The release of Andrew Davidson & Co., Inc.’s (AD&Co) new generation of financial engineering tools marks a shift to a new reality; when the traditional benchmark for MBS valuation, the LIBOR/ Swap yield curve, becomes unavailable. Our recent Product Release email informed our readers about the change. In short, our users can:
-
 Thoughts
FHFA held a listening session for interested parties on its proposed rule on the GSE process for credit scores. The objective is making mortgage underwriting and pricing more accurate and more fair while balancing practical implementation by firms in the mortgage ecosystem. Along with many others, I had the opportunity to provide insights on this proposed rulemaking.
-
 Thoughts
In our January 19th blog entitled, A More Equitable Lending System Will Not Be Created by Accident, we described the efforts it will take to overcome not just bias in lending today, but the systemic factors that have limited access to credit in the past and have created an unjust system.
-
 Thoughts
In this short blog post I discuss some developments taking place in the flood insurance landscape in the US and look ahead at a few potential directions things could go. I suggest that universal catastrophic flood insurance coverage with a continuation of the introduction of risk-based pricing would be a significant improvement.
-
 Thoughts
Introduction
The Government-Sponsored Enterprises (GSEs) entered conservatorship in September 2008. One could view the succeeding thirteen years as a journey back to financial stability with a refined operating model that looks more like a financial utility than a hedge fund. This business model is more compatible with a fair lending mission for a standard-setter that maintains secondary markets under an effective regulator. The GSEs remain the largest part of the housing finance backbone and a resilient funding source during economic stress.
-
Thoughts
Around 75% of white American families were homeowners in the first quarter of 2020, according to data from the United States Census Bureau. However, only 44% of Black American families owned their homes at the same time.
-
Thoughts
According to a report by the Research Institute for Housing America, climate change risk is rapidly increasing in the housing industry and will continue to demand more attention and regulation in the near future.
-
Thoughts
Mortgage market participants are keenly aware that the Federal Reserve has been scaling back its UST and MBS purchases and factoring the outcomes of its actions on stakeholders across markets.