

Welcome to The S-Curve
Now you will be able to receive the latest announcements, product updates, and our insights on the mortgage market in real time.
The name of the blog, the S-Curve, is a reflection of our logo and the central feature of our prepayment model. S-curves are seen in nature in many phenomenon, from population growth to prepayment and default models. Our first S-curve, in the early 1990s, used the arctangent function, then piece-wise linear functions, and evolved over time to be more complex and vary by FICO, loan size and LTV. This evolution encapsulates both the timeless nature of fundamental relationships and constant innovation to describe them better over time.
We hope you find the information useful and we look forward to your feedback.
-
 Introducing MARS+ as the Next Generation of Mortgage Analysis and Reporting SystemProducts
Andrew Davidson & Co., Inc (AD&Co) is pleased to announce the beta release of MARS+, the next generation of Mortgage Analysis & Reporting System (MARS), which has been in use since 2008 for performance reporting of AD&Co models. MARS+ aims to provide enhanced and advanced capabilities and features for mortgage analysis and reporting.
The new enhancements of MARS+ include:
- Simplified access to AD&Co models and data from a single page
- Enhanced filtering and stratification of back-testing data
- Distribution of data for key mortgage data analysis parameters
- Model performance visualization and tabular display for selected data of interest
- Customizable dashboards for effective reporting of actual and model results along with data characteristics
In what follows, we summarize how to use the various capabilities and features of MARS+.
Selecting, Filtering, and Stratifying Data of Interest
The initial screen of MARS+ labeled as ‘Model & Data’ provides user interface components that are grouped into three categories: (1) Model & Data Inputs, (2) Filters, and (3) Stratification.
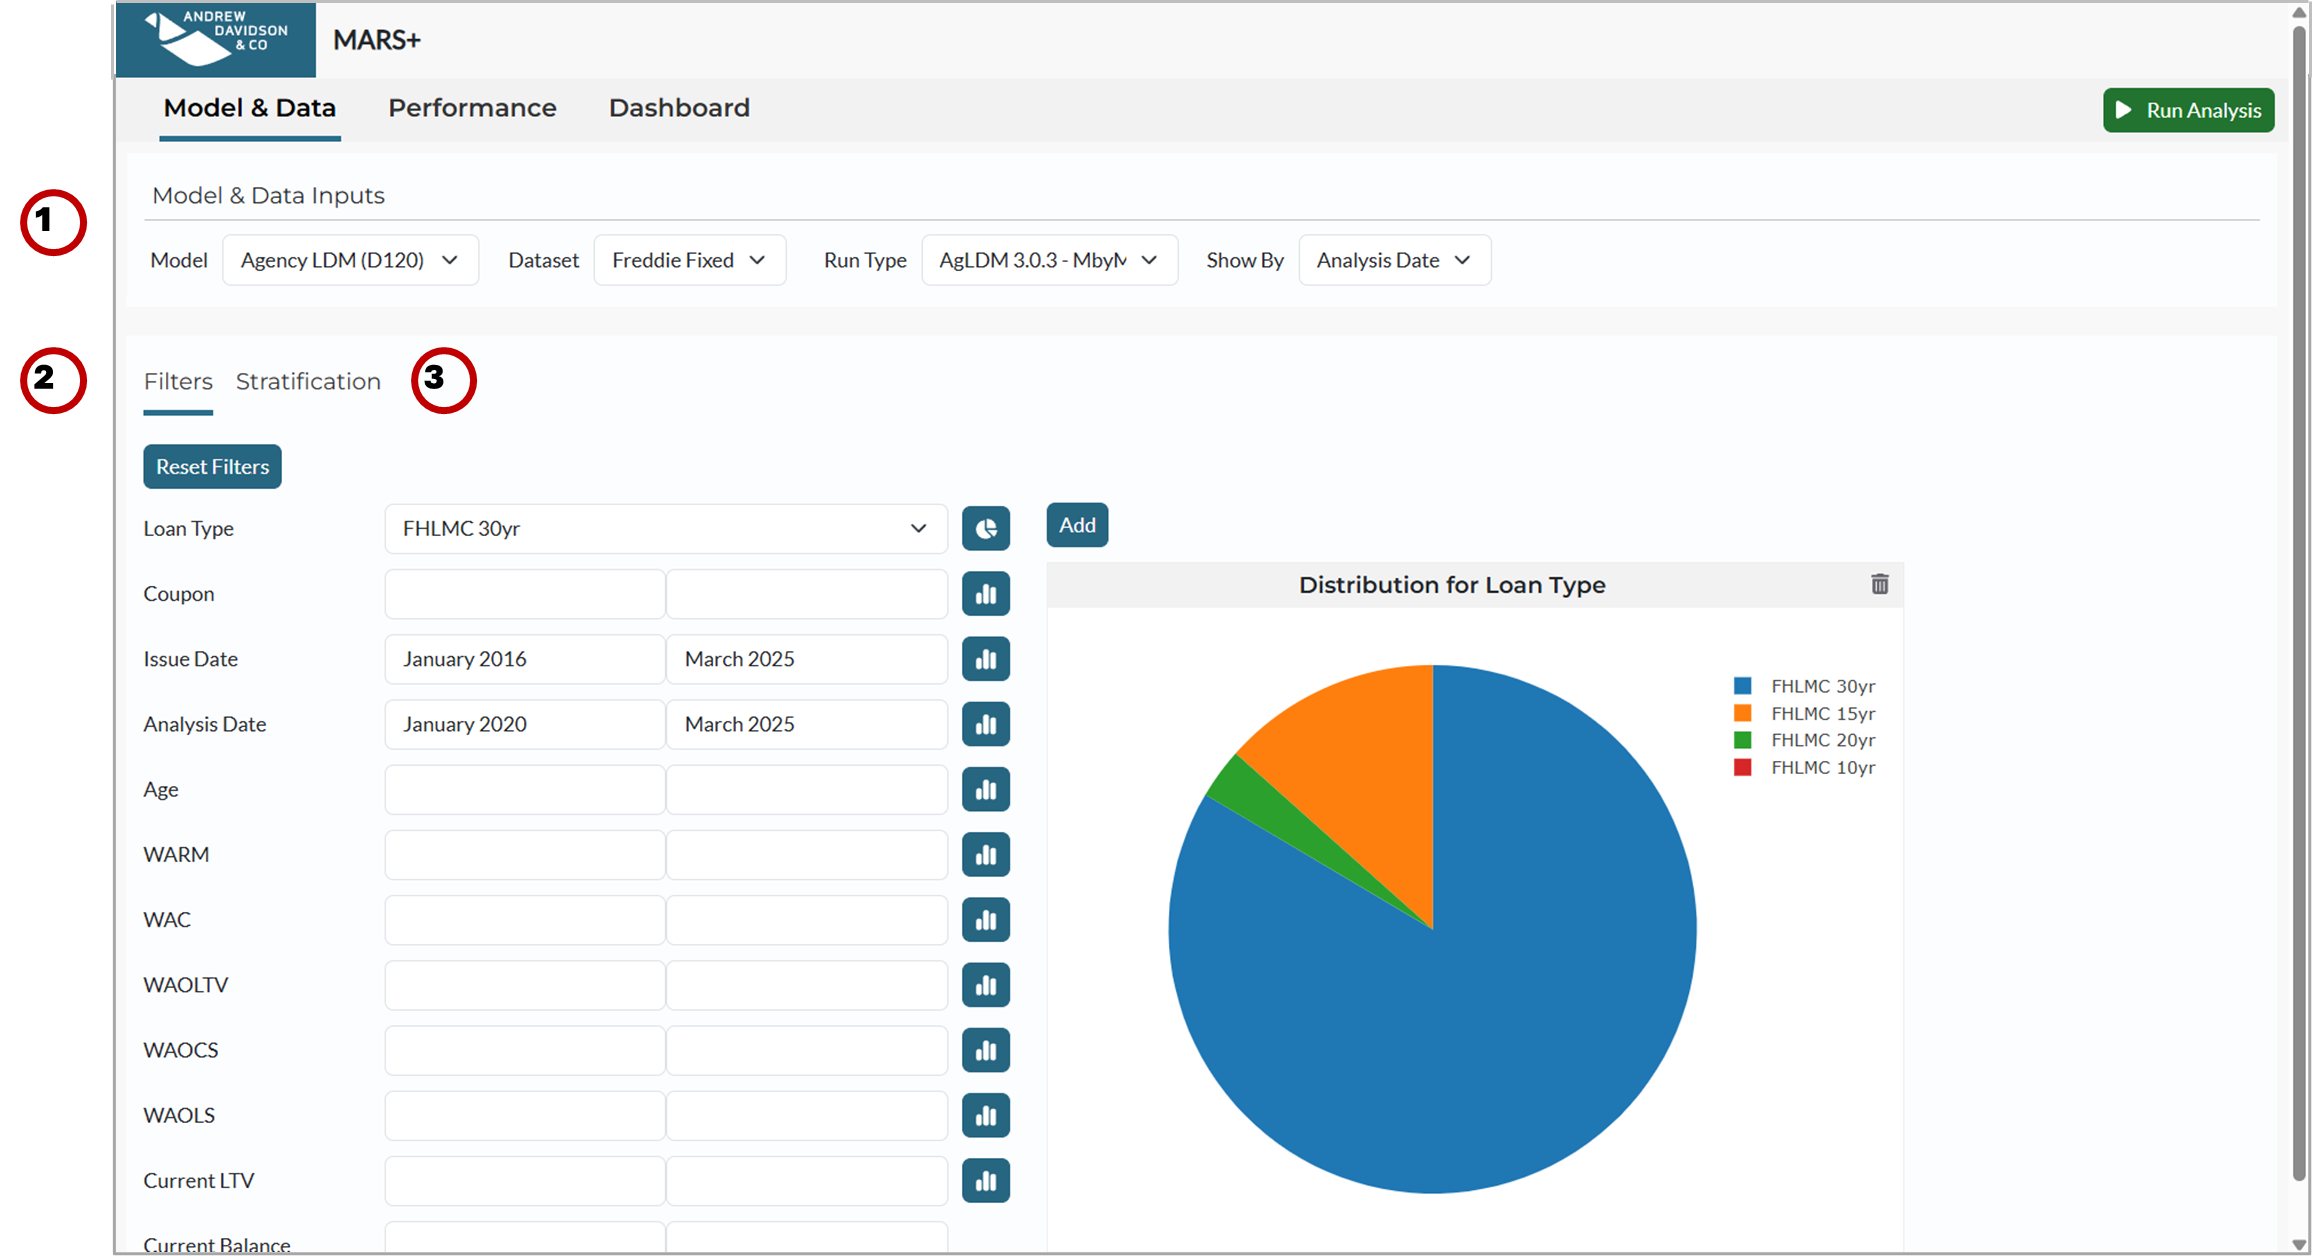
For selected filter and stratification data parameters, the ‘Model & Data’ panel also provides a distribution icon to the right of each filter and the parameter selected for stratification. Upon clicking on a distribution icon, the distribution of the selected data parameter is displayed as a pie chart or a bar chart to the right of filters or stratification bucket definitions.
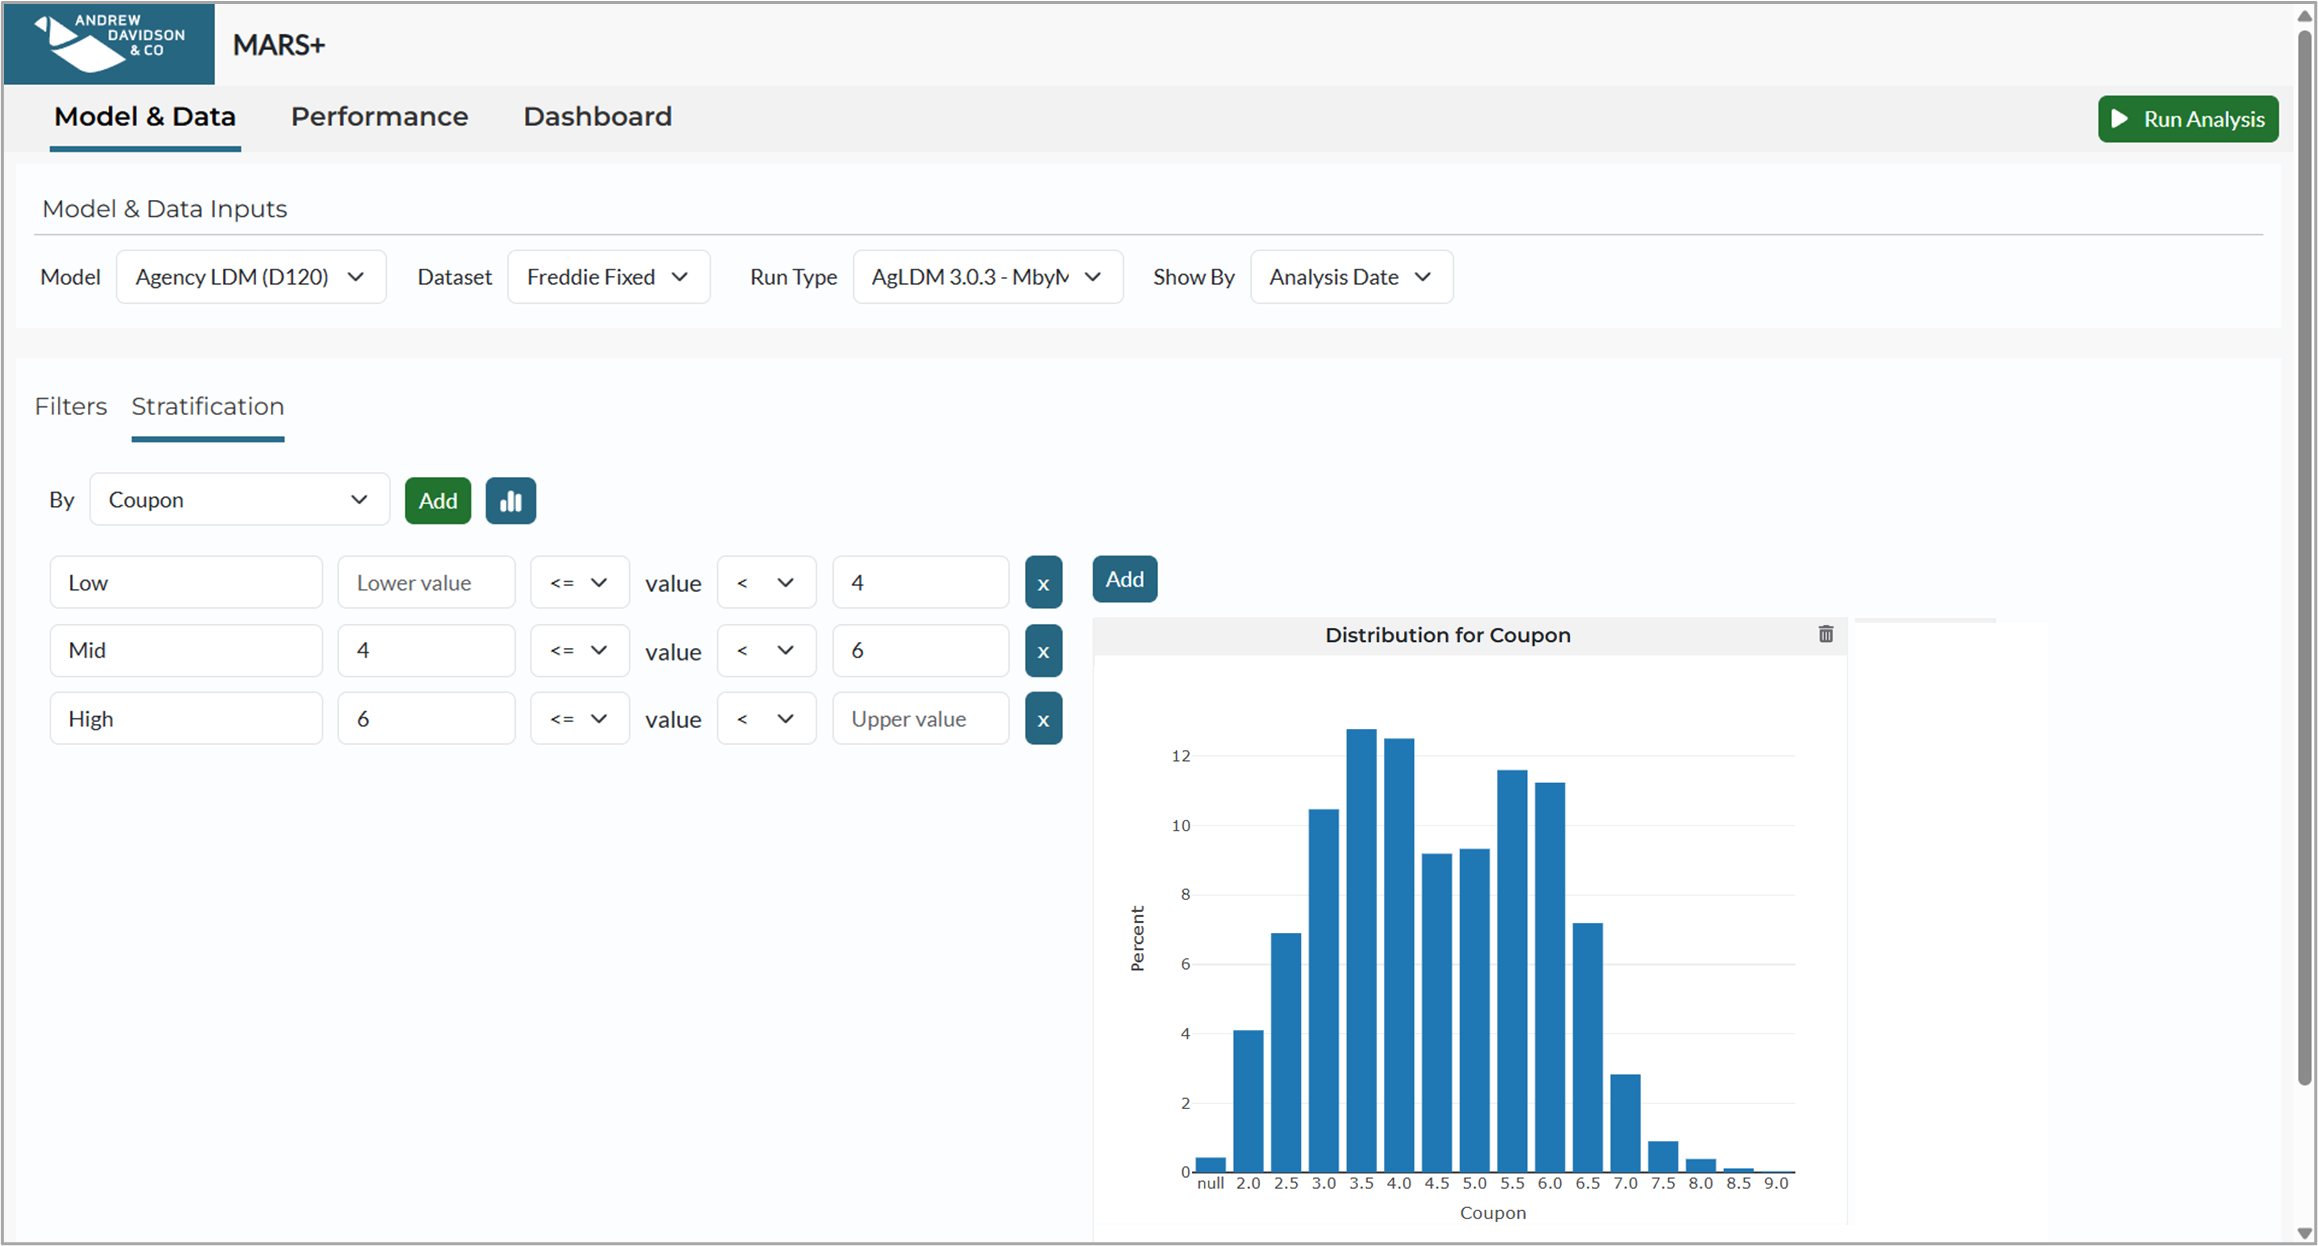
Any distribution chart shown in the ‘Filters’ and ‘Stratification’ panels can also be added to a dashboard to save it for future use, like re-using and continuing the analysis later or for reporting purposes.
Once the data of interest has been defined in ‘Model & Data Inputs,’ ‘Filters,’ and ‘Stratification,’ clicking the ‘Run Analysis’ button will start the retrieval of actual and pre-calculated model data, and display both actual, that is, historical back-testing data and model results for comparison.
Performance Results
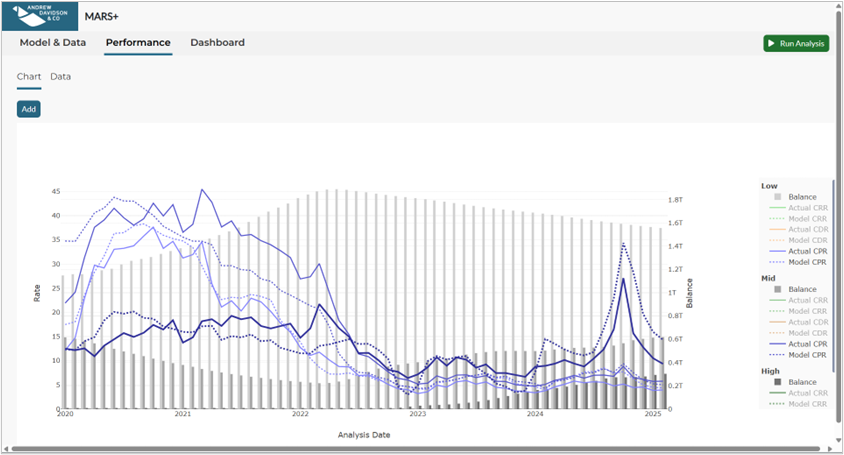
The ‘Performance’ panel displays both actual and model results in an aggregated and stratified form in terms of an interactive chart and a data table as shown in the screenshot below.
While the default chart view typically displays a few parameters, like CPR and Balance, the view parameters can be selected or de-selected from the chart legend.
Any chart or data table viewed in the ‘Performance’ panel can also be added to an existing or a new dashboard to save it for later use.
Dashboard Views
MARS+ provides its users with the facilities to create several dashboards as needed and save them in their local browser’s storage. A dashboard can have up to four components, including user-selected charts and tables generated during the user’s MARS+ session. The following is a sample dashboard with four components that are generated from an analysis run based on selections, filtering, and stratification done in each of the sample screenshots above.
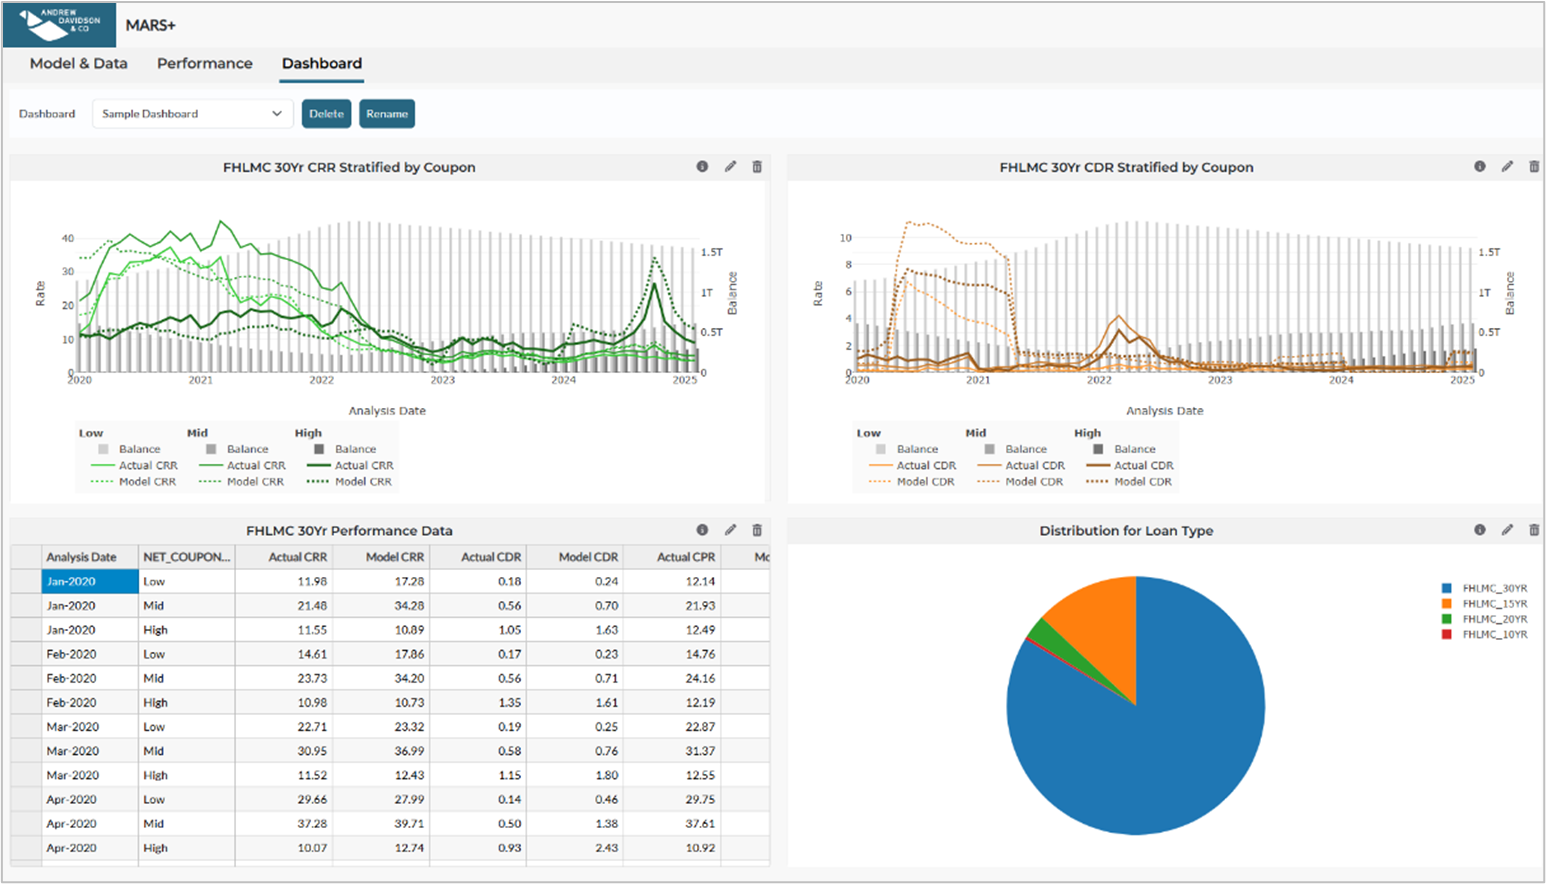
Each dashboard component can also be edited, deleted, or moved within the dashboard.
What is next?
MARS+ will evolve during the beta period in terms of its capabilities, features, and data coverage based on the feedback we receive from our clients and users as ideas, suggestions, questions, issues, and requests. There are also a few planned improvements that we would like to implement during the beta period, including but not limited to:
- Extending the data distributions covering all mortgage data used by our models
- Providing data distribution charts for user-selected dates
- Developing a persistent and secure server-side storage infrastructure enabling users to re-use saved filters, stratifications, and dashboards with original as well as updated data
- Providing additional chart types to display residuals as well as model forecasts beyond the historical back-testing data
Please contact us at support@ad-co.com with any feedback you may have, including your ideas, suggestions, questions, issues, and requests.
The S-Curve Archives
-
 Thoughts
Recently, aggregators have crossed market borders by issuing residential mortgage-backed securities (RMBS) backed by owner-occupied (OO), GSE-eligible conforming loans. Additionally, conforming mortgage loans have drawn investment interest from insurance companies fronted by aggregators and evaluated by third-party firms. These developments constitute historically rare disintermediations of the nearly monopsonist purchases of conforming loans by the GSEs.
-
 Podcast
Join Rob Landauer in a conversation with Abe Martin as they discuss his recent Pipeline article, "Modeling the Balance Behavior of HELOC Borrowers." In this episode, they highlight key points from the article as he shares insights into the draw component of HELOCs and provide an update on the beta rele
-
News
We’re excited to announce a major addition to the Andrew Davidson & Co., Inc. (AD&Co) team. Industry leaders Kelli Sayres and Gene Park, known for building and scaling leading fixed-income analytics platforms, have joined AD&Co’s Business Development team.
-
 Thoughts
Building on our earlier research on expanded consumer attributes, AD&Co continues to explore how credit data contributes to modeling delinquency and prepayment risk, which are key drivers of mortgage servicing rights cash flows and valuation.
-
 Events
Andrew Davidson recently joined NFM Lending’s Greg Sher on the One On One podcast to discuss our recent white paper, “The Impact of Moving Away From the Tri-Merge Standard.”
-
 Events
AD&Co recently sponsored and attended SFVegas 2026 and Optimal Blue Summit 2026. This post shares the AD&Co team's unique perspectives and key takeaways from attending both conferences.
-
 News
NewsAD&Co US Mortgage High Yield Indices
The Federal Reserve Economic Data (FRED) portal, housed by the Federal Reserve Bank of St. Louis, has been publishing AD&Co’s CRT indices since 2019. These series posted under the overall name of “US Mortgage High-Yield” include total return rates and credit and option-adjusted spreads (crOAS) – a projected return’s spread over Treasury (in the past, Libor). These series are available going back to 2014-end and tiered by CRT initial supports.
-
 Thoughts
In July 2025, the US Federal Housing Finance Agency (FHFA) announced that the government-sponsored entities (the Enterprises or GSEs), Fannie Mae and Freddie Mac, would permit lenders to choose between Classic FICO and VantageScore 4.0 credit score models for loans sold to the GSEs. FHFA also stated in a social media post that the tri-merge standard would be maintained for mortgage underwriting. Nevertheless, some mortgage industry stakeholders recommend moving away from the tri-merge standard for GSE mortgages in favor of a single or bi-merge report standard.
-
News
As housing faces more climate threats that result in more losses, the insurance program that it sits on is teetering on the brink of collapse. Yet, the home insurance market has three distinct stakeholders that have competing priorities, and today, there is no motivation for a collaborative solution.
Understanding how to strengthen and protect the current structure requires looking at the cost burdens along with the risk for each of those parties.
-
 Thoughts
There has been a flurry of activity in the mortgage markets since the 2018 passage of the Economic Growth, Regulatory Relief, and Consumer Protection Act. This act requires the Federal Housing Finance Agency (FHFA, now known as US Federal Housing) to validate and modernize the credit score models used in the housing finance system. It should be noted that so far, the discourse has been around mortgages sold to the Enterprises (Fannie Mae and Freddie Mac). Ginnie Mae has not provided any guidance on their plans to start using new credit score models.