
Welcome to The S-Curve
Now you will be able to receive the latest announcements, product updates, and our insights on the mortgage market in real time.
The name of the blog, the S-Curve, is a reflection of our logo and the central feature of our prepayment model. S-curves are seen in nature in many phenomenon, from population growth to prepayment and default models. Our first S-curve, in the early 1990s, used the arctangent function, then piece-wise linear functions, and evolved over time to be more complex and vary by FICO, loan size and LTV. This evolution encapsulates both the timeless nature of fundamental relationships and constant innovation to describe them better over time.
We hope you find the information useful and we look forward to your feedback.
-
 Mortgage Origination in a Post-COVID-19 WorldThoughts
In this blog post, we used the recently updated Mortgage Market Statistical Annual to examine the dynamics of residential loan origination by state and by market segments and highlight important trends.
From mid-2020 until April 2022, the Fed Funds rate was zero and fixed rate mortgage rates were historically low at about 3% (see Figure 1). Thereafter, the Fed began raising the Fed Funds rate to 5% today and fixed rate mortgage rates have doubled. Mortgage payments became unaffordable to many potential buyers and the mortgage origination volume dropped drastically across market segments and states by 80%. Predictably, the refinance market disappeared. Figure 2 shows that the origination volume for different mortgage products decreased drastically from Q1 2021 to 2023.
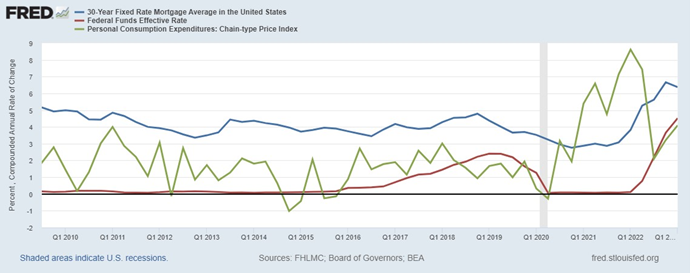
Figure 1. 30-Year Mortgage Rate, Fed Funds Effective Rate and PCE Price Index
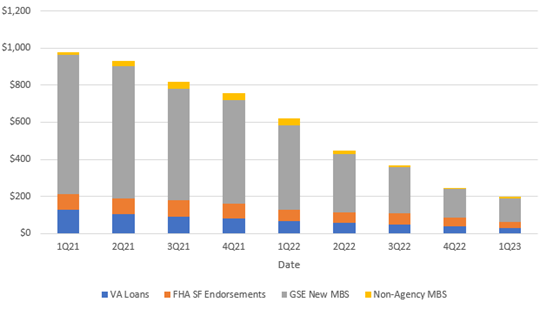
Figure 2. Origination Volume by Market Composition (Dollars in Billions)
Homeowners with low-rate mortgages have a strong financial incentive not to sell when facing the prospect of buying a new house with a mortgage rate twice as high (lock-in effect). These homeowners on the sidelines reduce both the supply and demand for housing. The countervailing impacts on price make the ultimate effect unclear; prices could rise or fall, but the changes are likely to moderate.
Figure 3 shows two things; (1) the housing price spike during the pandemic when rates were so low and the predicted recent collapse when rates rose and (2) turning points in housing prices lead to turning points in new construction rates weighted by population.
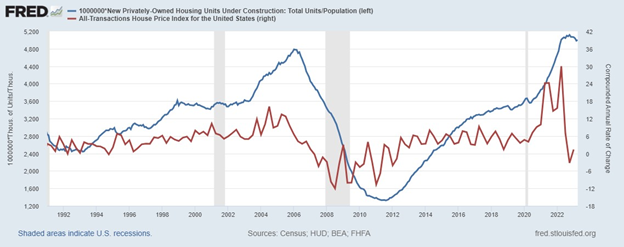
Figure 3. Housing Units Under Construction vs HPI
Looking at the States
Across the 50 states, plus Washington D.C. and Puerto Rico, origination dropped 48% from 2021 to 2022. For some background, YoY changes for the past few months have been positive, with 2019 to 2020 year-over-year (YoY) showing a 78% increase. We have to go back to 2016 to 2017 to see a negative 10% YoY drop and 2017 to 2018 a negative 9% drop. Among the most populous states, California suffered the largest drop YoY, declining by a whopping 60%. Some other states with a big YoY drop in origination include Maryland, 55%, Virginia, 54% and Massachusetts, 53%. On the other end, Texas and Florida had the smallest YoY losses at around 33%.
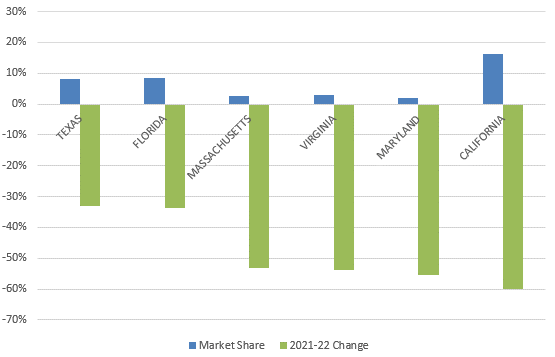
Figure 4 Originations by State
The situation in California, the most expensive state with the most expensive housing market was obvious; the escalating rate hikes priced many potential buyers out of the housing market in a state already hurt by the high income and property taxes.
The situations in Florida and Texas were drastically different. As low tax states, they represented good buying options even in a severe market turn and suffered the least drops.
Naturally, people are motivated to move to more tax-friendly states such as Florida when they retire. As the global pandemic hit and changed how people live and work, it further amplified that migration trend. Workers who once needed to live in states with hot employment markets like California’s tech hub can now work remotely and leave for other lower-cost states.
From Refinance to Purchase
The ten consecutive Fed rate hikes eliminated the refinance boom and deterred existing borrowers from moving, a combination leading to the plunge of origination. The refinance share has fallen from 71% in Q1 2021 to 16% in Q4 2022. On the turnover side, purchasing activities are still ongoing amidst the high rate environment. Purchase volume is not as drastically changed but still has fallen 13% from 2021. Figure 3 still shows a very steady volume of purchase originations over the past two years, despite its obvious decline over the past months. The decrease of the purchase volume can be attributed to the “lock in effect.”[1] The lock in effect is visible for discount mortgages as it deters potential sellers from giving up their current low-rate loan and finance next property with a more expensive one even if they have plans to relocate.
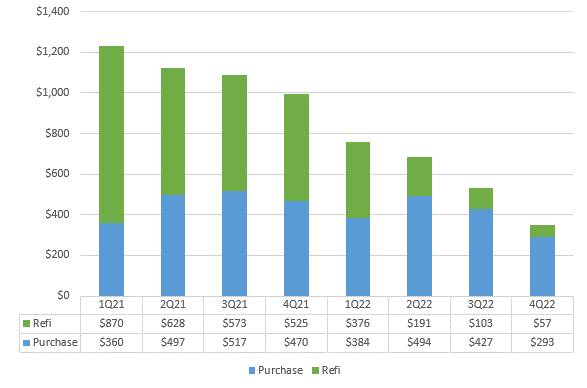
Figure 5. Purchase vs Refi Origination Volume (Dollars in Billions)
Looking Forward
We will continue to monitor changes in origination trends and their connection with affordability and home prices in our borrower behavior and home price modeling. For additional insight, read AD&Co’s HPI Outlook Update by Alex Levin.[2]
[1] Baker, Joni, and Daniel Swanson. “How to Use AD&Co’s Deep Discount and Super Premium S-Curve Tuning.” Quantitative Perspectives (May 2023).
[2] Levin, Alex. “AD&Co’S HPI Outlook Update: Flat, But Multidirectional.” The Pipeline, no. 182 (June 2023).
-
 Introducing the Kinetics Multifamily LoanDynamics ModuleProducts
Andrew Davidson & Co., Inc. (AD&Co) is pleased to announce the official release of Kinetics v1.10, the latest update to AD&Co’s modular platform for running the AD&Co suite of analytics. This update introduces the Multifamily LoanDynamics Module, the newest way to run Multifamily LoanDynamics Model (LDM). Investors, servicers, insurers and lenders can leverage this new module to better understand the prepayment and credit risk of their multifamily mortgage portfolio.
The Multifamily LoanDynamics Module joins MSRKinetics, PoolKinetics, the LoanDynamics Module, and the Auto LoanDynamics Module on the Kinetics platform. With this release, all flavors of LDM (Agency, Non-Agency, Auto, and Multifamily) are supported in Kinetics.
Kinetics v1.10 also includes enhancements to the LoanDynamics Module for single-family mortgages, including support for global tunings, a new Lifetime Results report with metrics such as WAL and lifetime CPR, and integration with the latest version of LDM: v3.0.3 patch 1.
Users can access the Multifamily LoanDynamics Module via the Kinetics desktop application (Windows), a web browser, or integration with the Kinetics REST API. AD&Co can provide a developer kit to those interested in integrating the Kinetics Web Service with their proprietary system.
Ready to schedule a demo of Multifamily LoanDynamics Module? Contact us to get started.
 Multifamily LoanDynamics Module Portfolio
 Multifamily LoanDynamics Module Custom Prepayment Penalty Points
 Multifamily LoanDynamics Module Results
 -
 Takeaways from Lessons Learned: Insights for Managing the Interest Rate Risk of BanksEvents
Andrew Davidson & Co., Inc. (AD&Co) held a webinar on June 8th entitled “Lessons Learned: Insights for Managing the Interest Rate Risk of Banks.” Mickey Storms from our Alliances and Policies team, Alex Levin from our Financial Engineering team and Andrew Davidson were featured speakers.
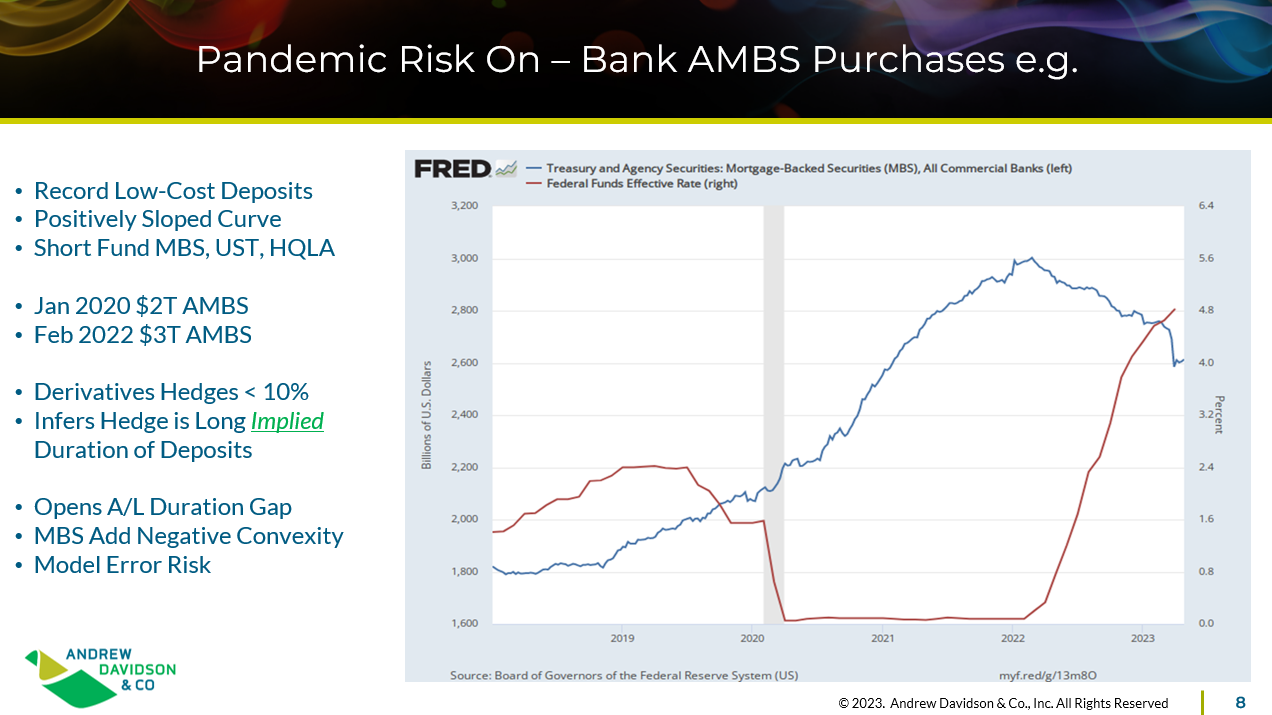
Mickey revisited interest rate changes since the onset of the pandemic and showed how these led to changes in appetite for yield curve risk at banks as interest rate declines compressed their Net Interest Margins (NIM) as depicted in the slid below. He went on to show how this appetite conveyed a questionable sense of comfort by banks that the Assets and Liabilities (A/L) duration gap would not be problematic in the future. The example presented was the strategy of increased short funding of MBS with deposits as rates fell during the pandemic, the success of which depended on an implied long duration of deposits to conceive of a manageable duration gap between A/L. He went on to show the significant duration that exists on the asset side of bank balance sheets and that in the absence of hedging, the success of short funding strategies relies critically on the behavior and duration of deposits whose behavior has changed recently. Mickey closed by pointing out that there has been a lack of regulatory focus on Interest Rate Risk (IRR) in recent years that accommodated banks taking interest rate and duration risk at U.S. Banks.
Alex considered several important methodological challenges in measuring IRR and the A/L duration gap. He began with the asset side and explained why an empirically developed prepayment model is not sufficient to fully capture AFS assets’ market sensitivities. For the purpose of replicating those sensitivities, a prepayment model needs to be “risk-neutralized” with faster refinancing and slower housing turnover – the main feared directions of the prepay-model risks. A risk-neutral model would better track market sensitivities of premium and discount assets, as illustrated by the dynamics of different duration measures during 2022 (a similar pattern observed across the TBA coupon stack).
As a risk-neutral turnover rate is slower than an actually observed one, the currently outstanding MBS portfolios (and most banks’ assets) are longer (duration-wise) than many people think.
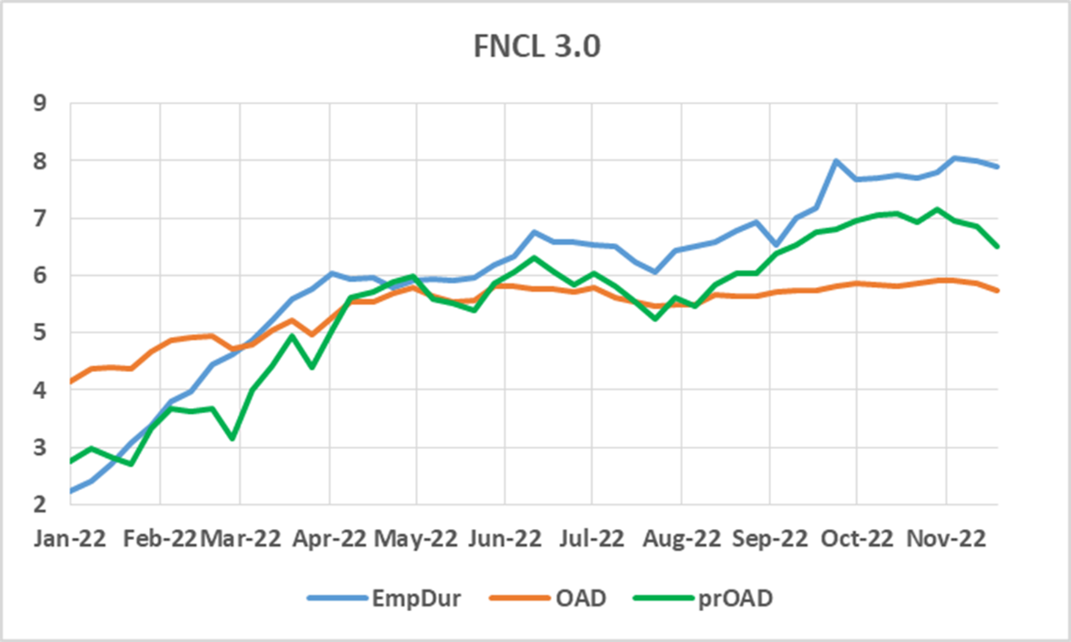
Comparative Duration Measures
OAD – Option-adjusted duration utilizing empirically developed prepay model
prOAD – Option-adjusted duration utilizing risk-neutralized prepay model
EmpDur – Empirical 60-day sensitivity measured from the daily moves of TBA price and 10-yr rate (model-free)Alex discussed the role of Non-Maturing Deposits (NMD). While an empirically defensible model of retention and paid rate is a good start, many external factors are typically not evident from historical data. Those include possible changes in the deposit base or media/bad press effects that could shorten the duration of NMDs. Therefore, A/L duration gaps are likely to be wider than ones measured.
Alex demonstrated a Net Present Value (NPV) analysis of a hypothetical bank with assets, term liabilities, and NMDs. He constructed a TBA-13-type of NPV of equity profile for two cases:
- NMDs are intact (chart on the left below)
- NMDs are replaced with par-valued liabilities having no intangible value to the bank (chart on the right below).
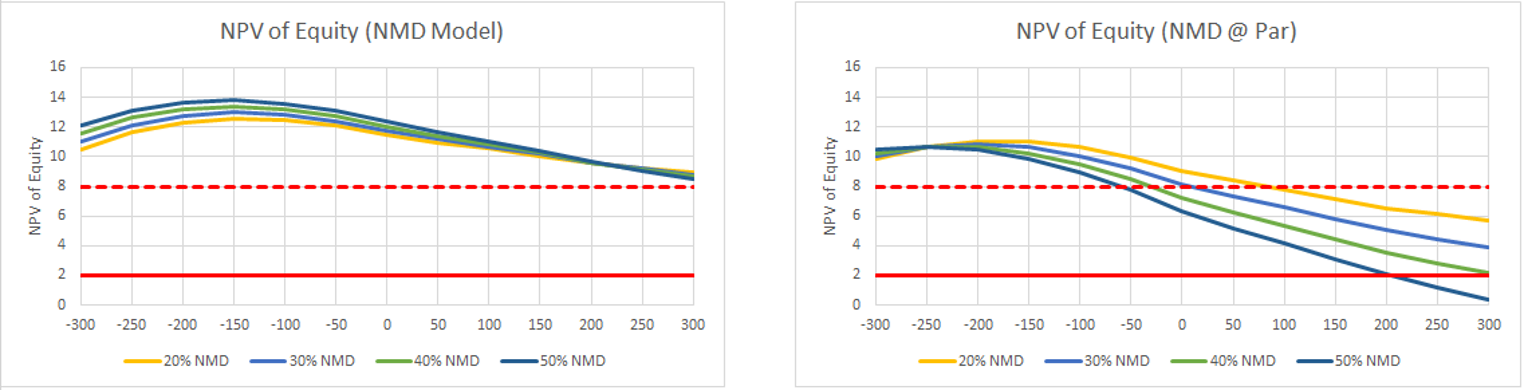
This exclusion of the economic value of NMDs from the NPV consideration is a useful stress-test we recommend banks conduct.
A bank’s hesitation to hedge IRR is commonly linked to a loss of NIM under the commonly steep yield curve. Under the current inversion, swaps have a positive carry that would improve NIM while closing (or even inverting) the duration gap. Alex demonstrated the use of a 3-year SOFR swap that would make the same bank duration-neutral while adding 50 bps of NIM or even inverting the IRR exposure while adding 100 bps of NIM.
Andy closed by dimensioning the two-way risks that exist with respect to future interest rates and the shape of the yield curve and pointed out how this may impact the dynamics of other assets and businesses that banks maintain. Among these were mortgage servicing and origination. He addressed bank risk management board roles, policies, procedures and controls and discussed the critical importance of an open culture with respect to risk insights and tactics. The review of models and scenarios used to manage IRR was also presented, as was the importance of asset diversification and capital allocation processes that include risk limits. He closed by talking about Basel 2 IRR analytical methods and how focusing on economic value, earnings and market are essential to effective IRR management.
Click here to view the presentation and webinar recording.
-
 Introducing a New Report Series on Specified Pool Prepayment TrendsProducts
Andrew Davidson & Co., Inc (AD&Co) is pleased to announce the beta release of a new monthly report series titled “Specified Pool Prepayment Trends,” which aims at showing market prepayment trends for specified agency pools in support of pay-up analyses by investors, traders, and alike.
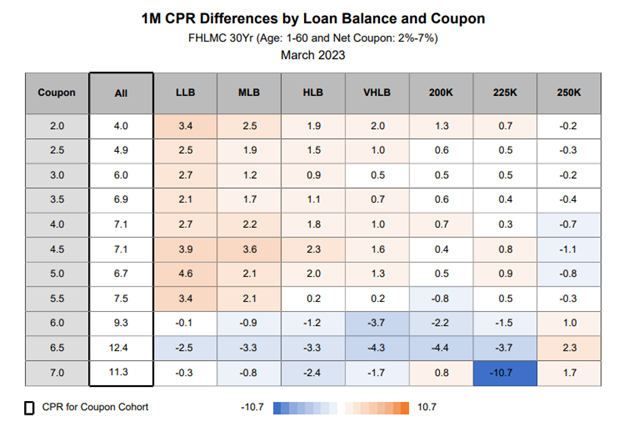
The reports in the beta release include 30-year Fannie Mae, Freddie Mac and Ginnie Mae II collateral and provide 1-, 3-, 6- and 12-month prepayment speed differences for specified pools in comparison with the overall prepayment speed of each corresponding, non-specific coupon cohort. The specified pools covered in the beta reports include only the pools defined by loan size buckets.
The following snapshot is a sample report table where the "All" column shows the average prepayment speed for each non-specific coupon cohort. For each specified pool defined by a loan size bucket, the report shows the difference in prepayment speed between the specified pool and the "All" column. Faster speeds than the corresponding coupon cohort are shown as positive numbers. Cells under each specified pool label are also colored using the color legend shown below.
While each report provides a monthly reference point for pay-up analysis, a sequence of monthly reports may also have the potential to observe and track changes in mortgage prepayment speeds under different macroeconomic conditions.
During the beta period, we will continue to enhance and enrich the “Specified Pool Prepayment Trends” reports. We look forward to your comments, suggestions and feedback to make these reports more informative and useful to you.
Please contact us at support@ad-co.com or (212) 274-9075 with any questions or suggestions.
-
 Auto LDM Available in PolypathsProducts
Andrew Davidson & Co., Inc (AD&Co) is pleased to announce that Polypaths LLC supports AD&Co’s Auto LoanDynamics Model (Auto LDM) providing prepayments, defaults and losses on auto loans and securities.
It is imperative in today’s ever changing economic environment to assess and manage financial risk. Polypaths’ integration of AutoLDM, in conjunction with their market leading solutions, allows users to analyze auto loans and securities when implementing risk and portfolio management strategies.
AD&Co is excited to introduce readers to Pathways, Polypaths’ monthly newsletter which features news and updates related to recent product enhancements, upcoming webinars and other events, along with a detailed case study focused on a particular question or exercise. Pathways Issue No. 43 provides readers with a case study discussing their support of auto loans and securities.
Current subscribers of Pathways can access Issue No. 43 here: https://polypaths.com/clientarea/pathways/. If you would like to subscribe and receive a set of credentials for Pathways, please contact support@polypaths.com.
The S-Curve Archives
-
 Products
The release of Andrew Davidson & Co., Inc.’s (AD&Co) new generation of financial engineering tools marks a shift to a new reality; when the traditional benchmark for MBS valuation, the LIBOR/ Swap yield curve, becomes unavailable. Our recent Product Release email informed our readers about the change. In short, our users can:
-
 Thoughts
FHFA held a listening session for interested parties on its proposed rule on the GSE process for credit scores. The objective is making mortgage underwriting and pricing more accurate and more fair while balancing practical implementation by firms in the mortgage ecosystem. Along with many others, I had the opportunity to provide insights on this proposed rulemaking.
-
 Thoughts
In our January 19th blog entitled, A More Equitable Lending System Will Not Be Created by Accident, we described the efforts it will take to overcome not just bias in lending today, but the systemic factors that have limited access to credit in the past and have created an unjust system.
-
 Thoughts
In this short blog post I discuss some developments taking place in the flood insurance landscape in the US and look ahead at a few potential directions things could go. I suggest that universal catastrophic flood insurance coverage with a continuation of the introduction of risk-based pricing would be a significant improvement.
-
 Thoughts
Introduction
The Government-Sponsored Enterprises (GSEs) entered conservatorship in September 2008. One could view the succeeding thirteen years as a journey back to financial stability with a refined operating model that looks more like a financial utility than a hedge fund. This business model is more compatible with a fair lending mission for a standard-setter that maintains secondary markets under an effective regulator. The GSEs remain the largest part of the housing finance backbone and a resilient funding source during economic stress.
-
Thoughts
Around 75% of white American families were homeowners in the first quarter of 2020, according to data from the United States Census Bureau. However, only 44% of Black American families owned their homes at the same time.
-
Thoughts
According to a report by the Research Institute for Housing America, climate change risk is rapidly increasing in the housing industry and will continue to demand more attention and regulation in the near future.
-
Thoughts
Mortgage market participants are keenly aware that the Federal Reserve has been scaling back its UST and MBS purchases and factoring the outcomes of its actions on stakeholders across markets.
-
Thoughts
The growing prevalence of artificial intelligence in the mortgage industry is shining a new light on the human biases that have pervaded the industry since its inception. AI is meant to bring fairness and objectivity to mortgage decisions, but it can’t perform fairly if it was built on an unfair system.
-
Products
The LDM v3.0.2 library adds AutoLDM to the v3.0.1 library.
Key benefits include: