

Welcome to The S-Curve
Now you will be able to receive the latest announcements, product updates, and our insights on the mortgage market in real time.
The name of the blog, the S-Curve, is a reflection of our logo and the central feature of our prepayment model. S-curves are seen in nature in many phenomenon, from population growth to prepayment and default models. Our first S-curve, in the early 1990s, used the arctangent function, then piece-wise linear functions, and evolved over time to be more complex and vary by FICO, loan size and LTV. This evolution encapsulates both the timeless nature of fundamental relationships and constant innovation to describe them better over time.
We hope you find the information useful and we look forward to your feedback.
-
 Andrew Davidson & Co, Inc. (AD&Co) Turns 30: What’s the Definition of an Industry Pioneer?Thoughts
Dear Friends,
As Andrew Davidson & Co., Inc. (AD&Co) reaches its 30-year milestone, I reflect on two seemingly contradictory ideas: Firms need experience to guide clients through difficult times but sometimes it is necessary to discard past practices to achieve breakthroughs.
As a 30-year-old firm with many of employees having worked at the company more than ten years and several well past the twenty-year point, we feel confident that as individuals and as a firm, we have experienced a wide range of market conditions and a variety of obstacles. This level of experience is valuable when there are market disruptions, providing us with perspective on risks and opportunities. The rapidly rising rates within the last few months, mirror the rate increases of the early 1990s.
The sub-prime meltdown in 2007 was one of many historical cases where declines in underwriting quality ended poorly. Of course, each event is unique. The 1994 rise in interest rates shook the markets as new derivative products, in particular inverse floaters, caused significant disruptions. And the 2007 subprime crisis had far greater effects on the overall economy than the previous failed underwriting episodes. Neither “this time is different” nor “history repeats itself” are entirely true.
While we are proud of our company history and experience, does that mean that in 1992, the then new Andrew Davidson & Co lacked experience and hence was an unreliable partner? I would like to think that we have provided valuable advice and insights to our clients from the start. In fact, some might say that people learn too much from the past, and particularly from their mistakes. A new firm may be willing to buck tradition and find a new and better way. As a new firm we brought approaches and techniques to the investment community that were still not widely accepted. Ideas including the use of option-adjusted spread valuation, demystifying inverse floaters and showing the risk of many types of CMO structures. In fact, we had a newsletter with Tom Ho’s GAT that focused largely on debunking the claims of marketers of dubious bonds.
Which then is better? To be the new disrupter or the voice of experience? Perhaps both. Perhaps neither.
I believe the key to the longevity and success of this company has been to find the right blend of historical knowledge and testable conceptual frameworks. Even as an upstart firm in 1992, we used decades of mortgage data to develop our models. We were also students of the history of the mortgage market: from the birth of the Home Owners’ Loan Corporation (HOLC) in the aftermath of the Great Depression (including the sad history of redlining); to the rise of FNMA, GNMA and securitization, the first CMO in 1983, and the Secondary Mortgage Market Enhancement Act (SMMEA) in 1984. It was the Federal Housing Enterprises Financial Safety and Soundness Act, adopted in 1992 that set the groundwork for the rapid expansion of the GSEs and contributed to the 2007 housing finance meltdown. The study of these events helps us to understand the role of the government in both causing and addressing inequality in housing finance as well as the role of the government in promoting and interfering with liquidity in the secondary market.
We recognize that experience is essential to understanding markets, but you don’t need to live through an event to understand it. The study of history and historical data is an essential component of analyzing the mortgage market. As interest rates rise, mortgage analysts would be well advised to learn about the late 1970s and early 1980s to see how the market performed when most loans were discounts, and into the refinancing booms of 1986 and 1987 to understand how rapidly the market was transformed by refinancing; the latter period had payment rates that greatly exceed those we observed in the recent refinancing waves.
On the other hand, data alone does not always produce good analysis. In 1992, a much of the mortgage market possessed the same data we did. However, many market participants were mired in outdated ideas that did not reflect the realities of the market. Our goal has always been to combine data with financial theory. We develop models of the behavior of financial products and look to data to validate or force a reconsideration of those ideas. When a model doesn’t work as expected, that’s not the time to deny the data, but rather to look to refine or revise your thinking. In that way, we are always ready to update (or disrupt) the prior way of thinking when the evidence supports new approaches and new ideas.
We may not anticipate every change in the market, but we have a disciplined approach to keep up to date. The number of times that we have provided advice that was not taken and then led to significant losses or firm failures is distressingly high: Pipeline managers that failed to hedge interest rate and/or basis risk; insurers who managed “through the cycle” without understanding how capital markets can disintermediate them; portfolio managers who hedged duration, but not funding risk. On the other hand, the number of firms we have helped navigate difficult times provides reassurance that we have been on the right track. We have convinced some firms to give up the yield of support bonds, hedge risk even if it reduces income, issue credit sensitive bonds (such as CRT) to reduce their concentrated risk, or alternatively buy credit sensitive bonds to diversify. Throughout the past 30 years, our models have provided hundreds of firms with the tools they need to measure and manage uncertainty.
I believe our combination of historical and conceptual perspectives is what makes our company unique and why we have stood the test of time.
We are currently applying our dual approach of historical information and conceptual frameworks to new areas of mortgage modeling. We are incorporating additional credit data such as trended data (revolver vs. transactor), utility data, and rental data into our models. Determining which data is truly additive and how to utilize data with short histories into the models requires a combination of statistical tools and modeler judgement to place the new variables into our credit framework.
We are also linking climate data to forecast models. To date there has been limited impact of climate stress on mortgage losses, but climate events have had a significant impact on delinquencies and forbearance practices and could have significant impact on borrower behavior and loan valuation in the future. Just as with new credit variables, predicting the future impact of climate stress requires the use of both historical data and conceptual frameworks to identify the potential pathways for climate impact.
We are extending our modeling to auto loans and other consumer receivables, extending the breadth of our expertise. And we are evaluating a variety of machine learning and artificial intelligence techniques, mindful of the need to make sure that these tools are not used merely to fit data, but also enhance our understanding of the underlying dynamics of borrower behavior. Even if some of the new techniques are currently inadequate to the task at hand, they provide insight into how to build models that can dynamically adapt to new data.
History and concepts are only parts of the story. Our teams and our collective dedication to our clients and industry are also essential ingredients in making the company what it is today. Our values have not changed in these 30 years: Value and respect all stakeholders, conduct ourselves with integrity and impartiality, and create opportunities for personal and professional growth while maximizing flexibility to experience life’s joys and face life’s obstacles. On this last point, we pioneered many employee benefits that are now coming into vogue: no dress code, no set work hours, no tracking of vacation days, time off for personal needs, paid sabbaticals, fee-only advisory for retirement accounts. Our business dealings with alliance partners and clients must always benefit both parties. Open and honest relationships are the source of financial success in the long run.
I would like to thank each of you for the support and encouragement you have provided to us over the years. We look forward to many more years of successful engagements as the future is transformed into the growing corpus of historical data and new ideas and financial concepts emerge from our mutual experiences.

Andy Davidson
• At Andrew Davidson & Co our mission is to serve as a trusted, independent, expert in the mortgage and adjacent markets and to leverage our knowledge base in service of our clients and our industry.
• We use our research and expertise to create valuable tools and solutions and offer them broadly through direct relationships with clients and in conjunction with other firms.
• We create opportunities for personal and professional growth while maximizing flexibility to experience life’s joys and face life’s obstacles.
• We value humanity, inclusivity, dedication, citizenship, creativity, and integrity.
• We manage our resources to achieve financial stability and long-term viability.
-
 Why Improving Access to Auto Loans Will Improve Job Stability and Diversity in the WorkforceThoughts
For many people, having accessible transportation (a car, for example) is necessary. Most U.S. people live in areas without adequate public transportation and require vehicles to access jobs, healthcare, and groceries.
Transportation barriers are among the many obstacles to achieving diversity and inclusion in the workforce. If people can’t get to work, people can’t get jobs. But the inaccessibility of auto loans is too often a barrier.
The solution isn’t as simple as applying for a car loan. Taking out risky, high-interest loans without understanding the terms is a dangerous move for borrowers. The practice might technically improve access to auto loans in the short term, but the long-run picture is bleaker. Predatory lending leads to more auto loan defaults and more barriers to owning vehicles, especially in lower-income brackets.
People work hard to make sure they can meet their financial commitments each month, and I believe there are many areas to improve accessibility when it comes to applying for an auto loan. Businesses that focus on helping borrowers with these areas will reap the benefits of workforce diversity while also doing good in their surrounding communities.
Financial Barriers to Employment
Life is unpredictable, and a stressed financial situation over a consistent period increases the risk of not being able to meet financial commitments. Unexpected costs pop up, resulting in borrowers being unable to meet their payments in already stressed situations. A chain reaction can then occur when a financial burden snowballs into losing a car, a job, or even a home.
Common barriers to employment include homelessness, substance use disorder, long-term welfare dependence, and lack of computer skills. Many companies also run background checks that include credit scores, even though it’s been proven that these models are biased against people who do not have generational wealth.
Even worse, predatory lenders often target the financially disadvantaged. Some lenders are incentivized to give out risky loans with high interest based on imperfect information. These loans are then sold so the originator is no longer responsible for the risk of the loan they originated.
This cycle ultimately leads to less diversity in the workforce. But we can overcome these barriers to employment if we start by resolving one thing at a time, starting with the transportation situation.
3 Necessities to Apply for an Auto Loan
A vehicle can get us back and forth to work, and it can also be a place to live in a pinch while getting things back together. But if someone lacks one of these key aspects of securing an auto loan, they’re likely to experience major barriers in the process:
1. Steady Income
Default rates on auto loans are closely correlated with unemployment. A steady income is becoming more ambiguous with the rise of the gig economy, but a good rule of thumb for borrowers is finding an average income received per month after taxes. If they don’t have a full-time job, they shouldn’t hesitate to take on gigs to earn income.
2. Healthy Credit Score
While some lenders may give borrowers an auto loan despite bad or no credit, a healthy credit score provides borrowers with the best rate. It’s important to remember that dealers are incentivized to give people loans, so borrowers will often feel pressure from salespeople. One way to alleviate that pressure is for borrowers to get preapproved with their bank first to get a better rate based on a clearer picture of their financial situations.
3. Monthly Expenses
It’s important for borrowers to budget and know where their money is going each month. This helps them understand what type of monthly payment they can afford. Personally, I break my spending down into two categories: essential (food, housing, utilities) and nonessential (streaming, cable, etc.). With an idea of how much they’re saving or spending, borrowers can make better financial decisions.
Getting to Work
No qualified job candidate should have to decline a job offer because they can’t afford to commute to work. But businesses can integrate transportation allowances into their hiring and onboarding processes for potential candidates.
At Andrew Davidson & Co., Inc., we are actively researching how to incorporate alternative metrics that can be used to help paint a more accurate picture of a person’s financial history. Some of these include paying rent and cell phone bills consistently on time, which are not included in traditional credit scores. This information can be used by either employers or auto lenders to make better decisions.
-
Drivers of Discount PrepaymentsThoughts
As interest rates rise and fewer loans with refinancing incentive remain, other factors are primed to play a larger role in determining prepayment speeds in the coming months (and perhaps years). Turnover, the rate at which people move, is the most cited of these factors. In this blog post, we’ll consider two other potential drivers: curtailments, or partial prepayments, and mortgage payoffs that don’t involve taking out a new loan.
The charts below the rates of curtailment and payoffs in a sample of Fannie Mae loan level data[1].
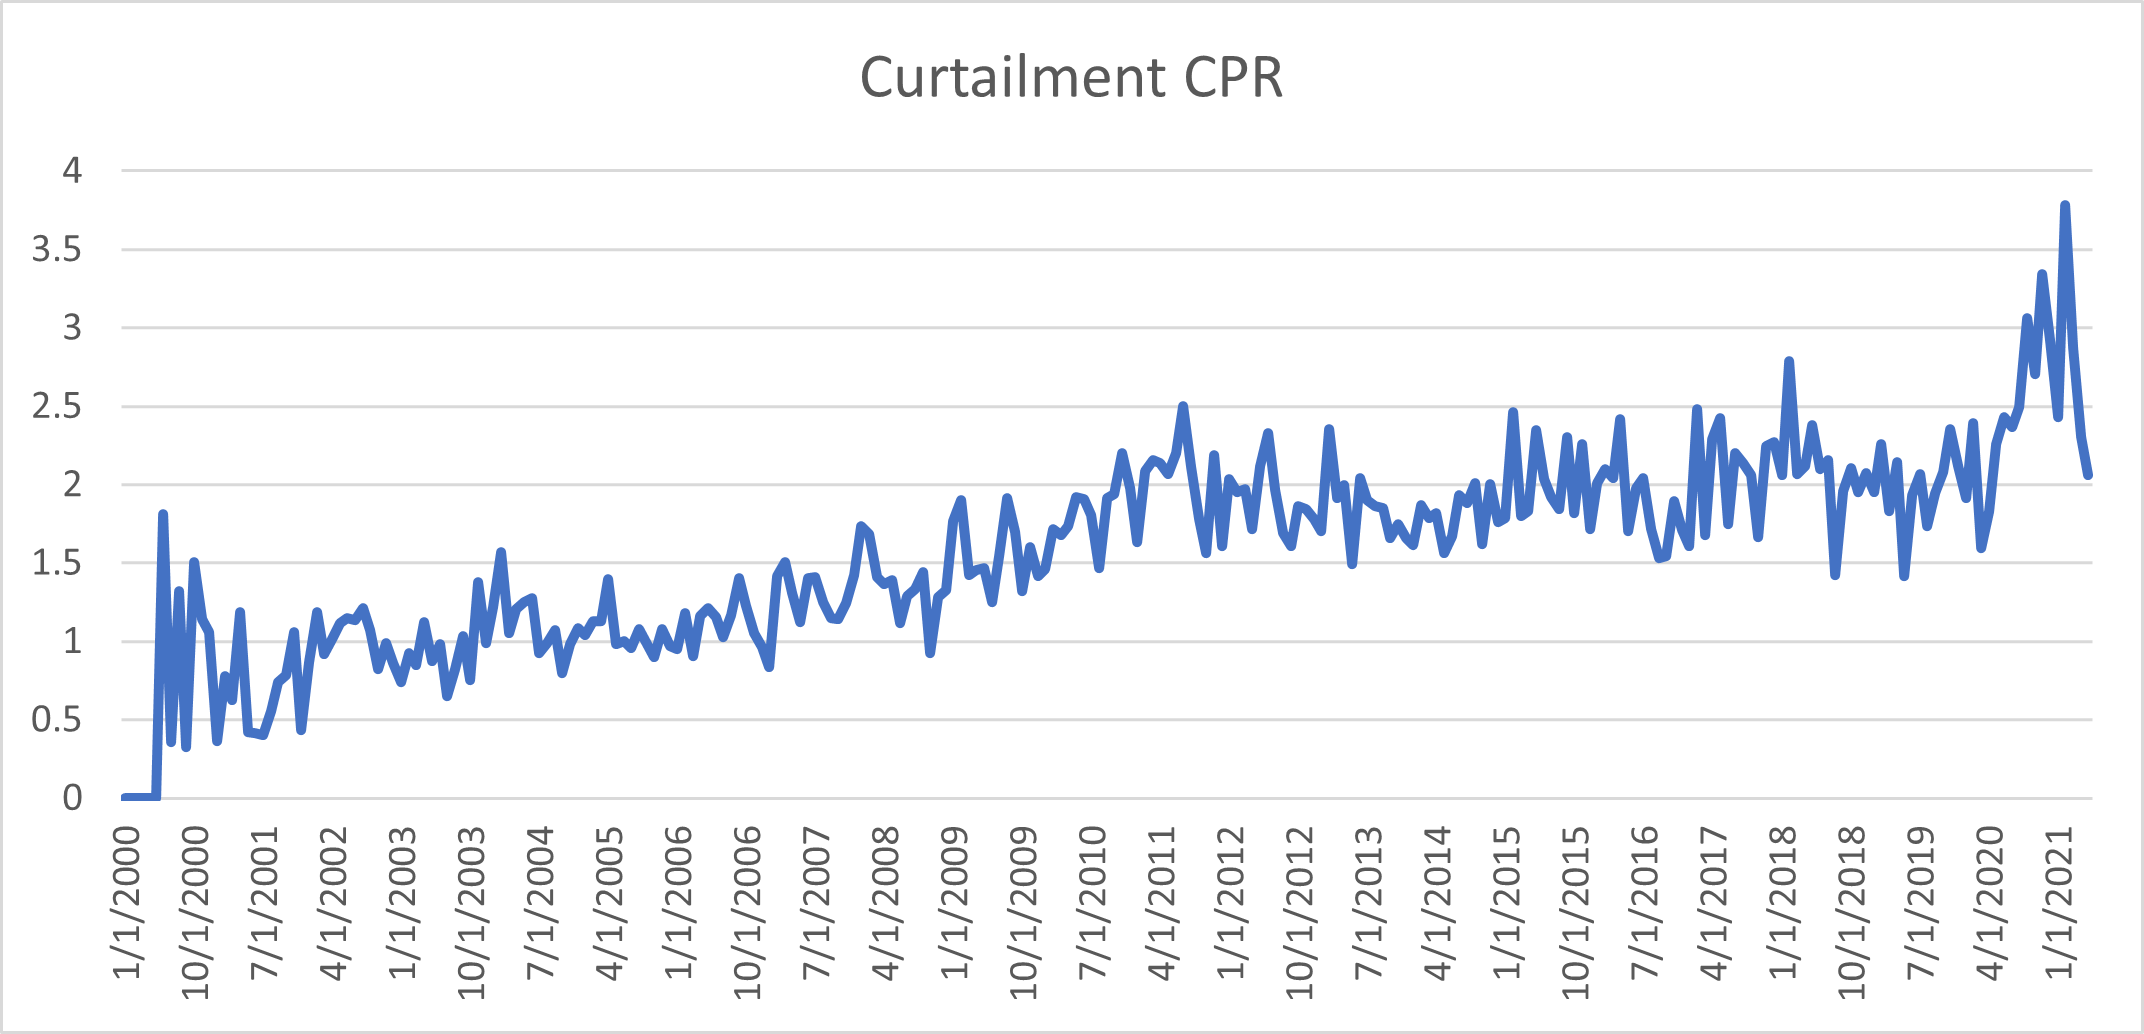
Curtailments involve borrowers making additional payments beyond their amortization schedule yet short of paying off the full amount, i.e., people making an extra payment each month. In the charts we can see the rate rising slightly over time (which is mainly attributed to age; this data only has loans originated after Jan 1999, so the earlier months are limited to younger loans) and settling into a rate around 1.5-2.5 CPR. However, there was also a bit of a jump during the pandemic, which can perhaps be attributed to borrowers having extra cash from stimulus payments.
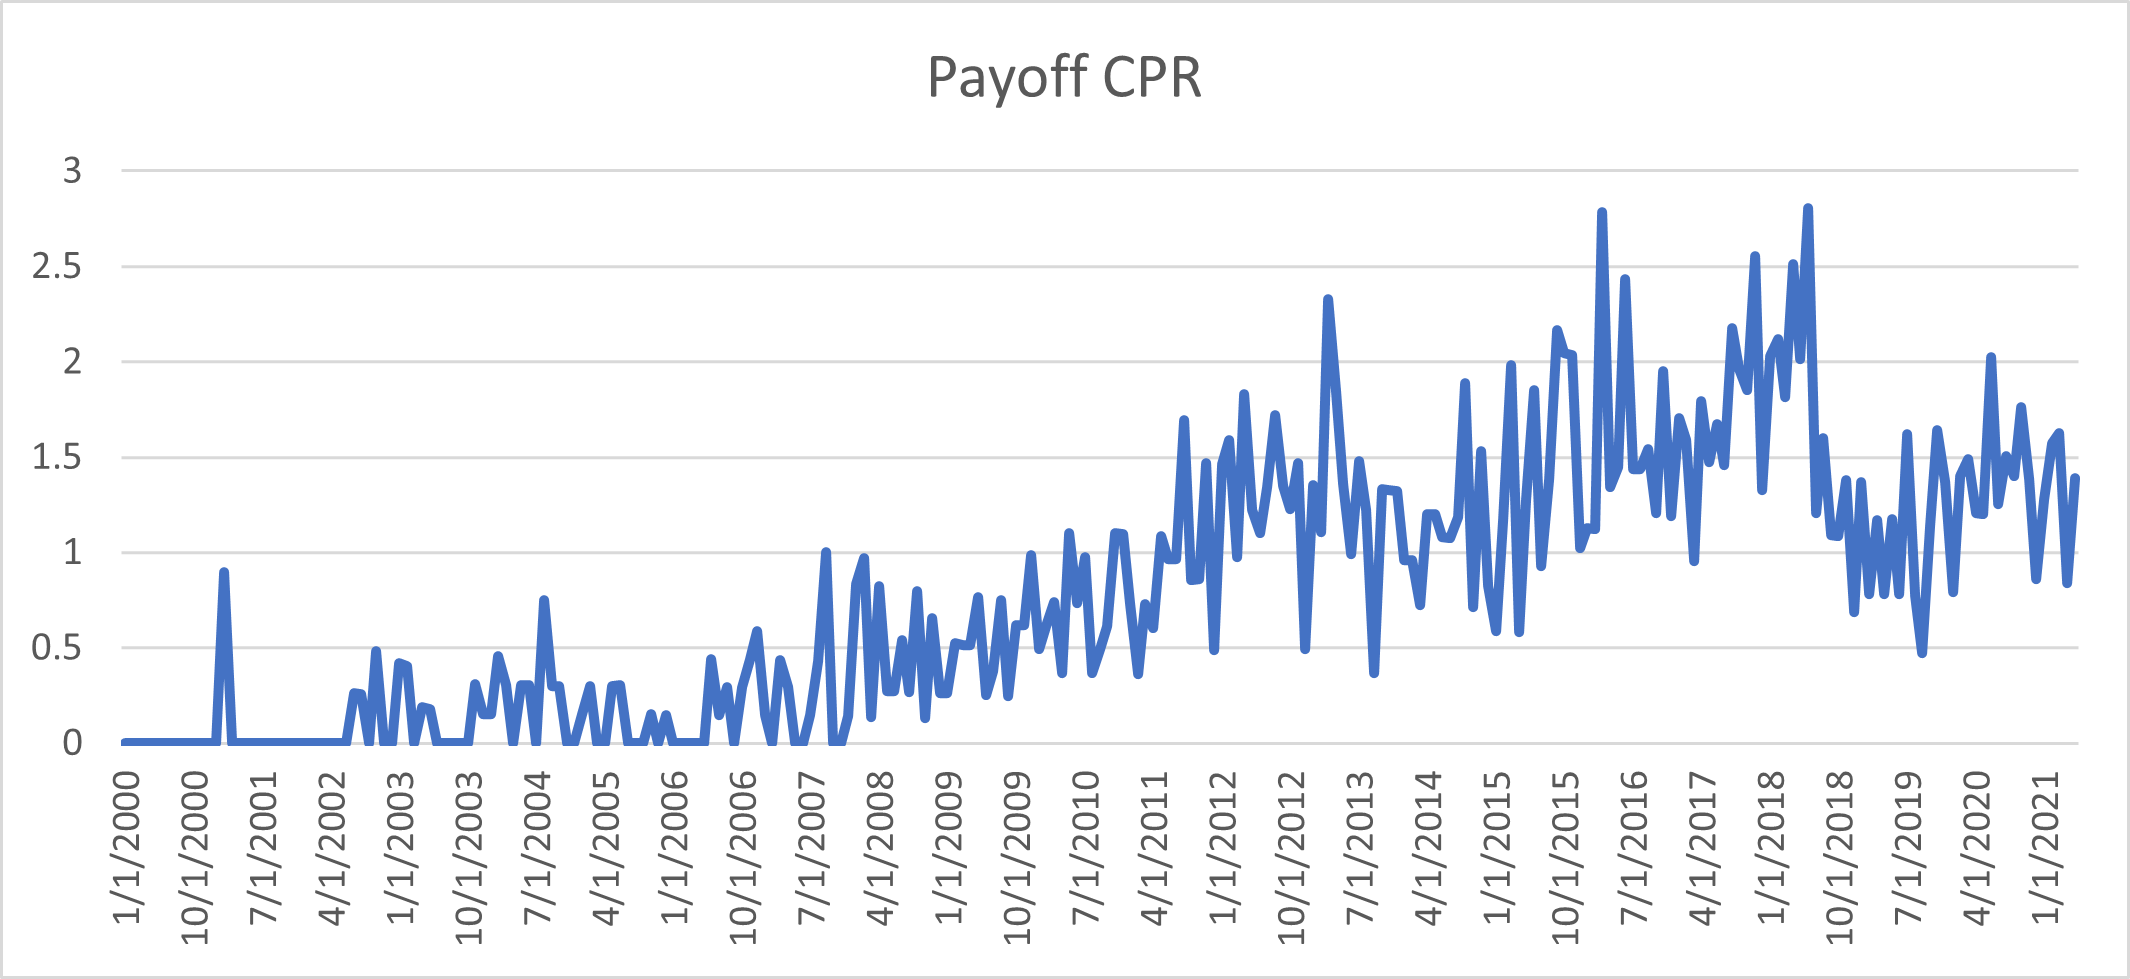
Full payoffs involve paying off a mortgage completely without moving or taking out a new mortgage, which tend to occur if borrowers find themselves with enough cash to cover the outstanding balance. While this can’t be known with 100% certainty, we’ve estimated the rate by looking at payoffs with a remaining term of 36 months of less. These are unlikely to be refinances and while we can’t rule out the possibility of the borrowers moving, we observe payoff rates loans with short remaining terms to be dramatically above the baseline turnover level. In essence, this chart shows the percentage of loans with short remaining terms (low) multiplied by their payoff rate (high) to get the overall contribution to CPR. Like curtailment, the data takes a while to ramp up, but then settles into 1-3 CPR range.
Both series represent a small percentage of prepayments in normal environments, but a greater percentage of the overall level in a world without refinancing. While it’s not a given that these numbers will remain constant in the face of rising rates, it is likely that these factors won’t have quite the same sensitivity to rates as refinancing (this study found payoffs to be relatively flat at negative incentive[1]). If rates stay high, it may be useful to keep these factors in mind moving forward.
[1] https://www.philadelphiafed.org/-/media/frbp/assets/working-papers/2019/wp19-39.pdf
[1] https://capitalmarkets.fanniemae.com/credit-risk-transfer/single-family-credit-risk-transfer/fannie-mae-single-family-loan-performance-data
-
Ability-To-Repay Benchmark UpdateThoughts
Summary
In 2021, Andrew Davidson & Co. Inc. (AD&Co) proposed a benchmark cohort approach to setting Ability-to-Repay (ATR) Qualified Mortgages (QM) standards. Successful benchmarks based on data are model-free and transparent, and the cohorts must perform consistently in comparison to one another and across time. Our original work used data through the early stages of the pandemic when non-performing loan percentages skyrocketed. This update shows that the cohorts continue to perform consistently.
To review; the metric is 60+ DQ (delinquency) rates at 24 months old for loans guaranteed by GSEs, FHA, VA, and non-QM securitizations. We update performance through late 2021 or early 2022 depending on the data source. The update turned out to be six to nine months past the peak non- performance rates (60+ DQ + Forbearance) of the pandemic. One of the best tests of reliability are cohorts that perform consistently at significant turning points. We show two different examples of cohort performance which all pass with flying colors.
Figure 1 extends the original time-series delinquency graph by cohort across combined federal segments (GSE, FHA, VA) and shows consistent performance through the two sharp turning points in delinquencies from the lows before the pandemic and the peak thereafter.
Figure 1. Delinquency Rates by Cohort
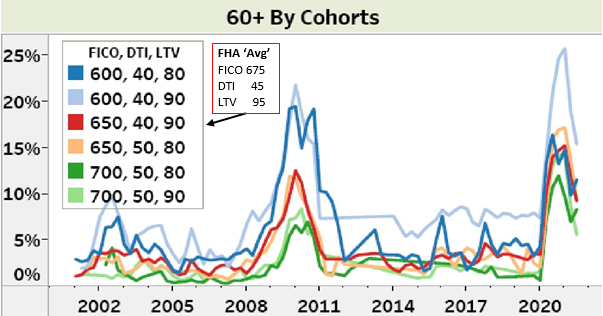
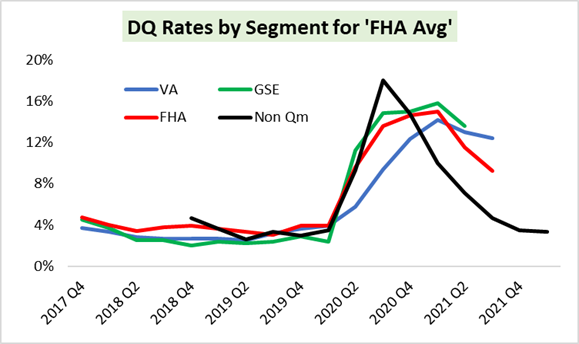
Figure 2 extends the time-series graph that compares the ‘FHA Average’ cohort for each of the three federal segments, GSE, VA, FHA, and non-QM. The ‘FHA Average’ cohort is roughly 95 LTV, 680 FICO, 40 DTI for government lending, and about 90 LTV, 680 FICO for non-QM. The results continue to illustrate that the benchmark cohorts perform consistently across market segments.
Figure 2. Delinquency Rates for ‘FHA Average’
Conclusion
The pandemic and the federal response to it are unprecedented in modern times for their impact on the US economy and housing market. Nevertheless, mortgage cohorts performed consistently over the last several years across federal and non-QM segments, increasing confidence in this approach. This stability contrasts with the vastly higher non-performance rates of the subprime and reduced documentation era that resulted from poor lending practices, as we reported in the original study.
This highlights that conscientiously measuring income is essential to consistency.
-
 How Lowering Capital Costs Affects Higher Risk LoansThoughts
How Lowering Capital Costs Affects Higher-Risk Loans
Government-sponsored enterprises (or GSEs) are companies that provide guarantees and financing to originators through the mortgage secondary market. The size and resilience of the GSE secondary market maximizes diversification and liquidity which reduces financial risk and cost of capital. This benefit accrues to conforming borrowers through lower mortgage rates and resiliently available financing.
Capital Safe Investments
One hundred years of the stock price performance of public utilities shows higher dividends, combined with lower returns and capital costs than an index of large companies. Theory indeed predicts that companies in protected markets would have lower income volatility that translates into lower stock price volatility and lower required returns.
This can be seen empirically by comparing two ETFs (exchange traded funds), XLU, the largest and oldest utility ETF, launched in 1998, versus SPY, the S&P 500 index. Since inception, XLU’s price return is about 130% (compared to SPY’s 280%), and its 10-year annualized return is 11% (compared to SPY’s 16%). However XLU pays a persistently higher dividend yield of 2.9% compared to 1.2% for SPY, and shows lower price volatility with a beta of 60%, compared to SPY’s beta of 100%. This is evidence that protected markets are safer havens to beat inflation with lower risk. Firms generally price to a 12%-15% return on equity, while regulated utilities generally price to 5-10% ROE. Even though ETFs are not individual companies, XLU and SPY’s performance have implications about GSE capital cost, which is the largest component of guarantee fees.
The Benefits of Lowering GSE Capital Costs
Fannie Mae and Freddie Mac (the GSEs) charge guarantee fees to compensate for the risk of guaranteeing and securitizing mortgages. These fees are included in the mortgage rate. The GSE guarantee conveys the lowest possible rate on mortgage backed securities through to borrowers. Lowering guarantee fees on higher-risk loans would lower mortgage rates and cumulatively, could save borrowers up to $3,000.
For example, for a $300,000 mortgage at 4%, the monthly P&I payment would be $1432. However, lowering the guarantee fee (and the mortgage rate) by 25 basis points lowers the payment $43 per month. This saves borrowers more than $3000 over seven years.
Lowering GSE capital costs to 6%-8% from 12%, could reduce guarantee fees by 25 bps for loans that require more capital without sacrificing financial resiliency. These borrowers are more likely to be lower-income, first-time homeowners or minority households. So, allowing the GSEs to retain federal backing as regulated utilities, and thus recognizing that GSE capital costs are lower than for fully private firms, can lower mortgage rates for higher risk loans which are more likely to be underserved populations.
Making Homeownership More Accessible to Lower-Income Families and Underserved Groups
Homeownership is the largest source of inter-generational wealth for working- and middle-class families, and the gateway is access to a mortgage. Especially for those whose access to homeownership has historically been hindered, financial security is enhanced by affordable credit. This regulated utility framework shows that the right public-private combination can focus enduring benefits on underserved communities to help build credit and long-term financial stability. National standards and lower mortgage rates help avoid predatory lending and never-ending debt — so that these households have a better chance to thrive in the financial marketplace.
Building wealth in underserved communities can begin by boosting individual wealth and lead to more local commercial activity. This can start the flywheel of positive economic community feedback that middle class and white neighborhoods are accustomed to.
As the largest mortgage financing provider, the GSEs have repeatedly shown resilient presence in the market in sharp contrast to mortgage segments that are not federally backed. They now operate more like regulated utilities and intermediate most risk into the public capital markets with an effective regulator setting standards for capital, credit and returns. The final component is to recognize their lower cost of capital and thus allow guarantee fees and mortgage rates to reduce accordingly.
The S-Curve Archives
-
 Thoughts
AD&Co held our annual employee meeting in Detroit, Michigan. In addition to gathering everyone in person to socialize and strategize, we use these annual meetings to learn about different cities, especially with regard to housing market dynamics.
We chose Detroit because the oft-maligned city is undergoing a significant renaissance, and we wanted to explore the area and learn how housing may have played a role in both Detroit’s decline and rebirth.
-
 Products
Andrew Davidson & Co., Inc (AD&Co) is pleased to announce the beta release of MARS+, the next generation of Mortgage Analysis & Reporting System (MARS), which has been in use since 2008 for performance reporting of AD&Co models. MARS+ aims to provide enhanced and advanced capabilities and features for mortgage analysis and reporting.
The new enhancements of MARS+ include:
-
 Events
Several AD&Co employees attended SFVegas 2025. This post shares their unique perspectives from attending the conference and key takeaways from the sessions.
-
 Thoughts
We’re excited to announce our latest Quantitative Perspectives providing in-depth insights into current market trends and advanced valuation techniques. This publication offers valuable information for mortgage market participants and those involved in credit risk transfer transactions.
-
 Podcast
Tune in to Laura Silberg's interview with Andrew Davidson, Eknath Belbase and Alex Levin as they discuss their latest Quantitative Perspectives, our independent commentary series, titled
-
 Thoughts
As providers of mortgage models for financial institutions, Andrew Davidson & Co., Inc. (AD&Co) enables clients to validate their use of our models and offers documentation describing the conceptual framework of the models, back-testing results, and sample forecasts under a variety of economic conditions. We also work with analytics providers who have incorporated our models to ensure that the models works as intended.
-
 Thoughts
We’re excited to announce two new Quantitative Perspectives that provide in-depth insights into current market trends and advanced valuation techniques. These papers offer valuable information for mortgage market participants and those involved in credit risk transfer transactions.
-
 Events
Andrew Davidson & Co. Inc. (AD&Co) proudly sponsored the Information Management Network (IMN)’s 10th Annual Mortgage Servicing Rights (MSR) Forum, held November 21 - 22, 2024 at the New York Marriott at Brooklyn Bridge.
-
Podcast
Tune in to Michelle Stepien Breier's interview with Alex Levin & Matteo Caracciolo-King as they discuss their latest Pipeline article “AD&Co Updates its Home Price Index Model.” The interview highlights key points from the article as they share recent updates to the HPI3 model.
-
 Thoughts
With the increasing volumes of Synthetic Risk Transfer (SRT) and Credit Risk Transfer (CRT) along with the discussion of BASEL III, we thought it would be useful to re-issue our comment letter to FHFA on the capital treatment of Credit Risk Transfer.