
Welcome to The S-Curve
Now you will be able to receive the latest announcements, product updates, and our insights on the mortgage market in real time.
The name of the blog, the S-Curve, is a reflection of our logo and the central feature of our prepayment model. S-curves are seen in nature in many phenomenon, from population growth to prepayment and default models. Our first S-curve, in the early 1990s, used the arctangent function, then piece-wise linear functions, and evolved over time to be more complex and vary by FICO, loan size and LTV. This evolution encapsulates both the timeless nature of fundamental relationships and constant innovation to describe them better over time.
We hope you find the information useful and we look forward to your feedback.
-
 On the Road Away from LIBORProducts
The release of Andrew Davidson & Co., Inc.’s (AD&Co) new generation of financial engineering tools marks a shift to a new reality; when the traditional benchmark for MBS valuation, the LIBOR/ Swap yield curve, becomes unavailable. Our recent Product Release email informed our readers about the change. In short, our users can:
- Conduct valuation relative to one of three benchmark rate curves: Treasury, LIBOR or SOFR.
- Provide either an absolute rate volatility matrix or the traditional relative volatility matrix.
- Apply a negative shift (floor) to otherwise positive-rate models (Squared Gaussian or Black-Karasinski).
The 3-benchmark valuation option provides analytical flexibility within the transitional period of LIBOR availability and well beyond; hence, this is both a "transitional" and "permanent" solution. Regardless of the benchmark chosen, SOFR-indexed ARMs and CMO/CRT floaters will use a SOFR term structure of rates (if provided) for the index projection. If a SOFR term structure isn’t provided, we will project SOFR indices off the chosen benchmark plus the initial spread.
The absolute volatility quotation has grown as a popular format. It represents the best practical choice when a valuation benchmark (e.g. Treasury) is different from a volatility source (e.g. options of SOFR swaps).
Which yield-curve benchmark should practitioners use for valuation? About 30-40 years ago, MBS were priced off Treasury bonds, a close investment alternative. However, Treasury rates have never been borrowing rates; this honor belonged to the LIBOR market. A pricing spread to a borrowing curve can be easily translated into return on equity (given the leverage) and, unsurprisingly, the LIBOR/Swap curve became the dominant benchmark.
With the upcoming demise of LIBOR, the current market trend suggests a return to Treasuries. Most dealers now report exclusively Treasury OAS on TBAs. The Security Finance Association (SFA) established a task force that recommended one of the Treasury-based spreads. The so-called I-curve (interpolated-WAL curve) was voted the best quotation option according to the SFA by “a supermajority of investors, traders and syndicate desks…across all structured finance products” whereas “issuers and bankers are split on the benchmark they favor with a slight majority preferring a Treasury-based curve over the SOFR swap curve.” To reiterate, our tools are ready for a change in prevailing practice.
What about the preferred source of volatility? With the Treasury curve returning to the benchmark role, which market volatility would we recommend of using? The only Treasury-related options – options on Treasury futures – represent a thin layer of information, which, at best can be interpreted as volatility on long bonds. While they may help decipher the value of the embedded prepayment option, they are less relevant to caps and floors found in CMO/CRT floaters and ARMs. It is also impossible to calibrate the mean reversion parameter of a term structure model without observing volatility quotes on differing tenors.
Our recommendation, which may be unexpected at a first glance, is to consider options on SOFR-based swaps that have developed in a way similar to LIBOR-based swaps. Since Treasury rates differ from SOFR-swap rates, we recommend using absolute (aka “normal”), rather than traditional relative (aka “lognormal” or Black), volatility inputs. Essentially, we posit that, given a tenor, various US rate benchmarks tend to exhibit similar volatilities. Our review of the SOFR/Swap volatility and LIBOR/Swap volatility confirms this assumption – despite the difference in rate’s levels.
Are we changing the Current-Coupon Yield (CCY) model? The existing CCY model is a linear regression calibrated to a multi-year historical movements against the 2-year and the 10-year points of either Treasury or swap rates. The SOFR term rates are relatively short in history and at the point of writing, there is no immediate reason to change the model’s coefficients when the SOFR curve is chosen as a benchmark. Going forward, this statement merits a review; the entire approach to projecting CCY from benchmark rates may also need to be reassessed.
Are we changing the LoanDynamics Model (LDM) at all? Borrower behavior for SOFR-indexed ARMs is likely to be unaffected by the index’s name, as long as we control for the current and projected loan rate. At this time, we have no history of SOFR-ARM prepayments or defaults that warrants any revisions of LDM.
-
 Insights on Updating GSE Credit Score PolicyThoughts
FHFA held a listening session for interested parties on its proposed rule on the GSE process for credit scores. The objective is making mortgage underwriting and pricing more accurate and more fair while balancing practical implementation by firms in the mortgage ecosystem. Along with many others, I had the opportunity to provide insights on this proposed rulemaking.
Insights
-
The mortgage credit score market is better served by 2 providers rather than 1, or 10. Other consumer credit markets have had two major providers for years and the main reason only one score is used for mortgages is regulatory restriction. Why two? The credit score market has core characteristics of a regulated utility. Providers are commercial enterprises that have barriers to entry and large externalities; negative if run poorly, positive if run well, and large information asymmetries. Their mission is profitable but not profit maximizing. Two regulated actors provide innovation and service to market while limiting confusion or destructive competition.
-
Credit providers set the rules for which score, not the credit requesters. There is concern that with a choice of credit scores, originators will pick off the GSEs. This is a false concern since FNMA (soon FRE) hasn’t used credit scores for years. As a major investor in credit risk, FNMA uses core consumer data and doesn’t rely on third party metrics. Estimates are that a dual score model could cost $500 M over three years. Since several thousand originators in other markets already use two scores this seems unlikely. Even if true, this amounts to 1 basis point on mortgage origination volume over this time.
-
Important consumer data is not included in classic credit scores today, and some may never be because they’re not credit data, such as Trended Data, Telecom Utility data, and rental data. Regulators should ensure that all card companies report Trended Data. Even if it’s possible to combine into one score, it may not benefit consumers to have an even broader opaque metric of their financial lives controlled by private companies.
-
It’s likely that expanding consumer financial data in mortgage underwriting and pricing will benefit first-time buyers and under-banked populations that have been historically discriminated. Since digital availability is widespread, transition expenses should not be a reason to avoid improving lending fairness.
-
The data necessary to build a quantitative bridge from old scores based on limited data to new scores based on expanded data should eventually be generally available so the broader market can make their own risk decisions as well as the GSEs (MIs, servicers, investors, researchers, etc.).
It’s clear that important consumer credit data is available outside classic credit scores and that perhaps should not be embedded into single consumer credit metrics. This extra data is quite likely to benefit first time homebuyers and underserved populations. Finally, it’s quite likely that this highly regulated, private market will provide larger benefits to consumers with two actors rather than one, or ten.
-
-
 Overcoming a Legacy of Bias in the Housing Industry: The Discussion ContinuesThoughts
In our January 19th blog entitled, A More Equitable Lending System Will Not Be Created by Accident, we described the efforts it will take to overcome not just bias in lending today, but the systemic factors that have limited access to credit in the past and have created an unjust system.
We have received much positive feedback on this blog and our earlier blog: In the Mortgage Industry, Who Qualifies as a ‘Good’ Homeowner? However, just as a more equitable lending system will not be created by accident, or even using seemly neutral analytical techniques, a more equitable lending system will not be created by a single individual or organization. Therefore, we believe it is important to highlight recently released research and analysis that can help advance a more equitable lending system.
First, Bankrate published a piece describing some of the sources of the racial wealth gap and several ways that people of color are Combating The Racial Wealth Gap: 9 Money Moves For Individuals of Color”. While many of the recommendations are applicable to anyone looking to engage with the financial system, they are especially important in communities that have not had full access to the financial system.
Second, the politics and sports analytics website, FiveThirtyEight, published a detailed study of the extensive residual impact of redlining, more than 50 years after the practice was banned, The Lasting Impact of Redlining. The study presents a disturbing portrait of how the legacy of redlining has remained imbedded in the structure of homeownership in America.
Finally, bringing many of these threads together, the National Fair Housing Alliance has released a framework for developing and accessing analytical systems used for making credit determinations. Their framework is consistent with the model development and risk management guidelines of the banking regulators and focuses on what steps are necessary during the Purpose, Process and Monitoring phases of model development and implementation.
The confluence of these and other studies and reports on improving access and fairness in the housing finance system are a welcome sign of potential progress, but are just the beginning of what will need to sustained effort to overcome a legacy of bias.
-
 Fixing Flood InsuranceThoughts
In this short blog post I discuss some developments taking place in the flood insurance landscape in the US and look ahead at a few potential directions things could go. I suggest that universal catastrophic flood insurance coverage with a continuation of the introduction of risk-based pricing would be a significant improvement.
Background
FEMA’s NFIP, which is required by lenders on at-risk properties, has a cap of $250,000 per property on residential properties and has recently evolved. This evolution has introduced risk-based pricing and will result in drops in many policy premiums (about 1.1 million properties) but also large increases (which will be phased in over years) in those of higher risk properties (about 200,000). FEMA is in the process of transitioning from using lagging flood zone maps to using commercial software similar to that used by the reinsurance industry for the purposes of pricing this risk. This has been covered in multiple articles recently in the media, as well as the topic of rising homeowner’s insurance policy premiums, which have been growing faster than inflation (since homeowner’s policies cover replacement value of homes, any increase in the cost of building materials would naturally show up in replacement cost, so inflation could be expected to pass through to homeowner’s premiums).
Somewhat less known is that FEMA has also been purchasing reinsurance since 2016. In 2021, the NFIP bought $1.15 billion in coverage from 32 private insurers. Additionally, in 2018 FEMA began to use the catastrophe bond market to also tap the capital markets for reinsurance, with the FloodSmart Re shelf. Including 2021 issuance, total coverage in place through catastrophe bonds is $2.9 billion.
Private flood insurance is also growing. In 2021, 58 private firms were writing flood insurance, with 2020 total gross premiums collected over $730 million. Between NFIP and private firms, the percent of homeowners surveyed by the Insurance Information Institute stating that they had some form of flood coverage has risen from 12-14% to a recent high of 27%.
Looking Ahead
To observers familiar with the mortgage market, the early moves made by NFIP appear similar to the introduction of loan-level pricing adjustments to differentiate borrower-level credit risk, and the creation of the CRT market to lay off portfolio credit risk using a combination of reinsurance and capital markets. However, the largest concern at this point in time is that there is no requirement to have coverage – unless the lender has identified the subject property as at-risk (the GSEs, for example, currently only require it for properties defined as at-risk based on the legacy FEMA flood map system, which means that at best the information used to make this determination is a decade old). This also means that as climate change increases inland flooding patterns and frequency, which is much less covered by legacy maps, a lot more homeowners are potentially at risk. It is worth taking a look at what other countries do.
Two basic approaches appear to exist in other developed countries. Under the first, homeowner’s have the option of extending their regular homeowner’s policy to cover flood. This approach is taken, for example, in Germany and Italy. Drawbacks of this approach are that because it is optional, only homeowners at higher risk take it up, and therefore it tends to be rather expensive. It also means that homeowners who underestimated their risk (which is more likely going forward due to the changing climate) are likely to find themselves self-insuring when they need it.
The second approach, taken by Spain, Japan and the UK, requires home insurance to include wind, fire and flood. The upside of this approach is that everyone is covered. While it increases everyone’s premiums, the increase is small for most homeowner’s and spreads the risk over the entire population. This approach doesn’t preclude the use of risk-based pricing, but instead sets a minimum level of flood coverage premium for every home – even those in areas that have never recorded flooding, but may in the future (given that rainfall patterns as well as the built environment is changing, future flooding may be less predictable using past flooding data).
Our system in the US shares a similarity with this second system, but it is hidden. NFIP has been operating at losses for a significant length of time and has been subsidized by Congressional appropriations, which are ultimately owed by the taxpayer. This means that losses beyond premiums collected is already socialized. Additionally, the lack of extensive coverage means that there are two sorts of uncovered losses. A typical low-grade flood event seems to result in losses in the $10-20,000 range, which one can imagine many homeowner’s managing to cover from personal resources (though many might also struggle). However, the largest disasters, such as hurricanes, result in average losses over $100,000. At this point the Federal government usually appropriates disaster funds. This is why, so far at least, these disasters have resulted in rebuilding and house price recovery more often than they have resulted in house price declines. This is the second form of socialization of losses.
It is important to point out that under this hidden system of universal coverage, both efficiency and equity suffer. In economics there is usually a trade-off between efficiency (which comes from allowing price signals to reach buyers to disincentivize risky behavior) and equity (subsidizing those who have the least). In this case, everyone is subsidizing those in flood-prone areas, many of which are higher-income vacation and second homes.
We can compare this approach to socialization of losses with a policy of universal flood insurance as a requirement towards obtaining a mortgage. Every homeowner would pay some minimum level of flood insurance premium. This could be for a catastrophic policy, meaning with a sufficiently high deductible that the policy would only payout when something truly disastrous happens, that a typical homeowner would be very likely to struggle with on their own. In contrast to the hidden universal system, higher risk properties would have substantially higher premiums, in some cases high enough to impact affordability. This would create an important price signal, indicating to a potential buyer that there is something to pay attention to in this location. Better yet would be a system similar to equipping a potential adjustable-rate mortgage (ARM) buyer with both a payment schedule based on current interest rates and one based on hitting periodic and life caps – disclosing not just current insurance premiums but the projected path of future insurance costs if they were to acquire that property. This would address the considerable informational asymmetry that exists in real estate markets, between developers and sellers, who know the area well, and buyers, who may be new to the area.
Right now, there is very little transparency with regard to future costs in owning a home beyond the mortgage payment schedule. The lack of insight into future insurance premiums is compounded by the potential for rising property tax assessments in the very places that also have high exposure to climate-driven natural risks. This is because the highest risk locations also face significant risk to their public infrastructure, which is funded by state and local taxes, often heavily reliant on property taxes. A universal requirement for flood insurance and risk-based pricing of that insurance would be an important step to improving this transparency.
Further Reading: https://www.iii.org/article/spotlight-on-flood-insurance
-
 GSE Credit Risk Capital and Guarantee Fees: An AnswerThoughts
Introduction
The Government-Sponsored Enterprises (GSEs) entered conservatorship in September 2008. One could view the succeeding thirteen years as a journey back to financial stability with a refined operating model that looks more like a financial utility than a hedge fund. This business model is more compatible with a fair lending mission for a standard-setter that maintains secondary markets under an effective regulator. The GSEs remain the largest part of the housing finance backbone and a resilient funding source during economic stress. While these evolved companies have been ready to be released back into the private market, they got stuck in conservatorship without capital.
The GSEs recently received permission to retain earnings, though it will take years to accumulate enough capital for independence; issuing equity will probably require congressional action but that seems unlikely. In the meantime, their regulator, the Federal Housing Finance Agency (FHFA), could take a major step by enabling the GSEs to build capital by issuing enterprise-level debt that, like Credit Risk Transfer (CRT), is subject to loss. In turn, this would shed light on the largest component of guarantee fees—the cost of capital.
Capital
Capital (claims paying ability in excess of revenues) is composed of debt as well as equity. Enterprise liabilities can be ‘high quality’ capital when they are subject to loss and have a clear payment priority that insulates taxpayers. The GSEs have transaction-based CRT debt whose cost is revealed in the capital markets, but they don’t have meaningful equity or enterprise debt to complete the picture. This leaves a large gap in capital and credit risk price setting that FHFA addresses by setting base guarantee fees and loan level price adjustments (LLPAs). Since the government provides a backstop for both the banks and the GSEs, rational pricing requires consistent capital requirements across these mortgage segments to avoid favoring one over another and distorting capital flows.
Indeed, FHFA’s recent NPR (notice of proposed rulemaking) on capital planning proposes using the Federal Reserve’s CCAR (Comprehensive Capital Analysis and Review) stress test to determine a GSE capital buffer. At least twice in the last few years FHFA has analyzed this stress test on the GSE credit portfolios. The stress test—roughly comparable to that of the financial crisis that began in 2007—resulted in pure capital needs of about 1% (combined with an implied discount rate around 12%) for today’s historically low risk credit portfolio. CRT market pricing is consistent with this result and Andrew Davidson & Co., Inc. (AD&Co) has also independently run this scenario, with similar results. We suggest a prudential buffer of at least 1% additional, while FHFA proposes a 0.75% floor for stress test capital in addition to other minimums. Employing our suggestion results in credit risk capital of roughly 2% (with a 12% discount rate), which is reasonable compared to the 4% that banks hold for whole loans that include funding and interest rate risk along with credit risk.
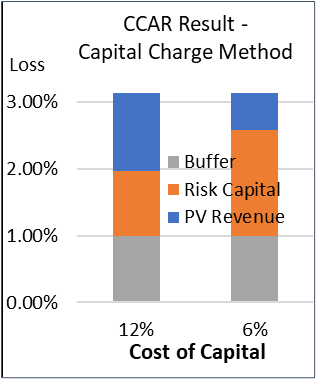
Logically, and by AD&Co’s Capital Charge method, Capital + PV Revenue should always equal PV stress losses. For example, lower capital costs and fees lead to somewhat higher capital needs. Using 6% capital funding cost (we discuss why 6% below) lowers required guarantee fees and raises risk capital from 1% to 1.6%. Since the existing credit portfolio is probably lower risk than average, we’ll round up risk capital + buffer to 3% capital in combination with the lower baseline guarantee fee. This leads to about $180B for the $6TR in GSE guarantees combined with about $30B in PV pure risk guarantee fees. The GSEs have about $50B in transaction-based CRT debt, which is probably worth at least $30B in enterprise capital. The GSEs do have about $75B in net equity ($200B preferred–$125B common), but it isn’t allocated between credit risk and other uses such as the investment portfolio, cash window, NPL (non-performing loan) portfolio, and others. Thus, we’re ignoring it for this simple example.
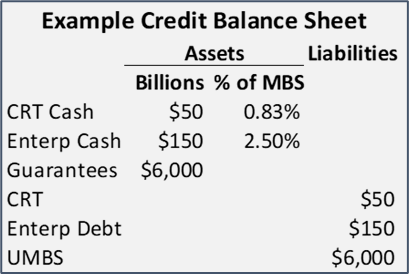
Suppose FHFA directed the GSEs to issue $150B in enterprise debt to protect taxpayers, that like CRT is subject to losses. Imagine a simplified credit balance sheet of CRT and enterprise liabilities, offset by cash assets, along with the off-balance sheet guarantees. Cash covers losses in excess of revenues and is shown as a share of sold portfolio. Guarantee fees are collected to service the debt.
We propose a simple payment order: deal-level CRT and guarantee fee revenue absorb losses before enterprise debt, which in turn limits the risk to taxpayers embodied by the Treasury backstop. Equity could be in front or behind this debt, which could be convertible so that it can be transformed into equity in the event that the GSEs are authorized to issue it.
Capital Costs
Capital costs are the largest component of guarantee fees, so accurately measuring them and achieving efficient market rates is critical. Actual GSE fees (net of the 10 bps unemployment tax) for 30-year loans are about 50 bps, with perhaps 12 bps for overhead and expected losses, leaving 38 bps to pay for (shadow) capital. We next compare these fees to the likely cost of GSE debt.
The $50B of CRT outstanding has a 4% current portfolio yield on bonds that are a combination of non-IG (investment grade) and low IG (perhaps 6% equity yield equivalent). Enterprise debt that is protected by CRT and fee revenue for a utility in a federally limited market is likely to be low investment grade. A ten-year average of single-A and BBB corporate yields is 3.25%, or about 100 bps above 10-year CMT yield. These two debt sources would be the entirety of GSE capital, with blended cost below 4% for the sold portfolio. This may seem low compared with equity returns, but it is the likely cost for the entirety of GSE debt capital in this proposal. Accounting for higher future interest rates and using a conservative 6% cost of funds would still lower guarantee fees in proportion to the risk.[1] Six percent funding cost probably holds while Treasury bond yields are below 5%; it’s been 20 years since 10-year CMT rates were persistently above 5%.
Costs for $180B (3%) of debt capital at 6% yield on the $6TR portfolio is 18 bps, 20 bps lower than the current estimate of 38 bps. We add a Treasury payment to compensate for the risk of taxpayer exposure, which is likely high-investment grade, 5–10 bps. Spreads on the market debt may be tighter because of the size and consistency of GSE infrastructure underlying their primary and secondary markets, both of which are regulated, along with the Federal backstop. However, that doesn’t mean the debt is subsidized, since its risk would be entirely owned by the private market and the risk of the federal backstop is paid for in fee and in exchange for complying with the housing mission.
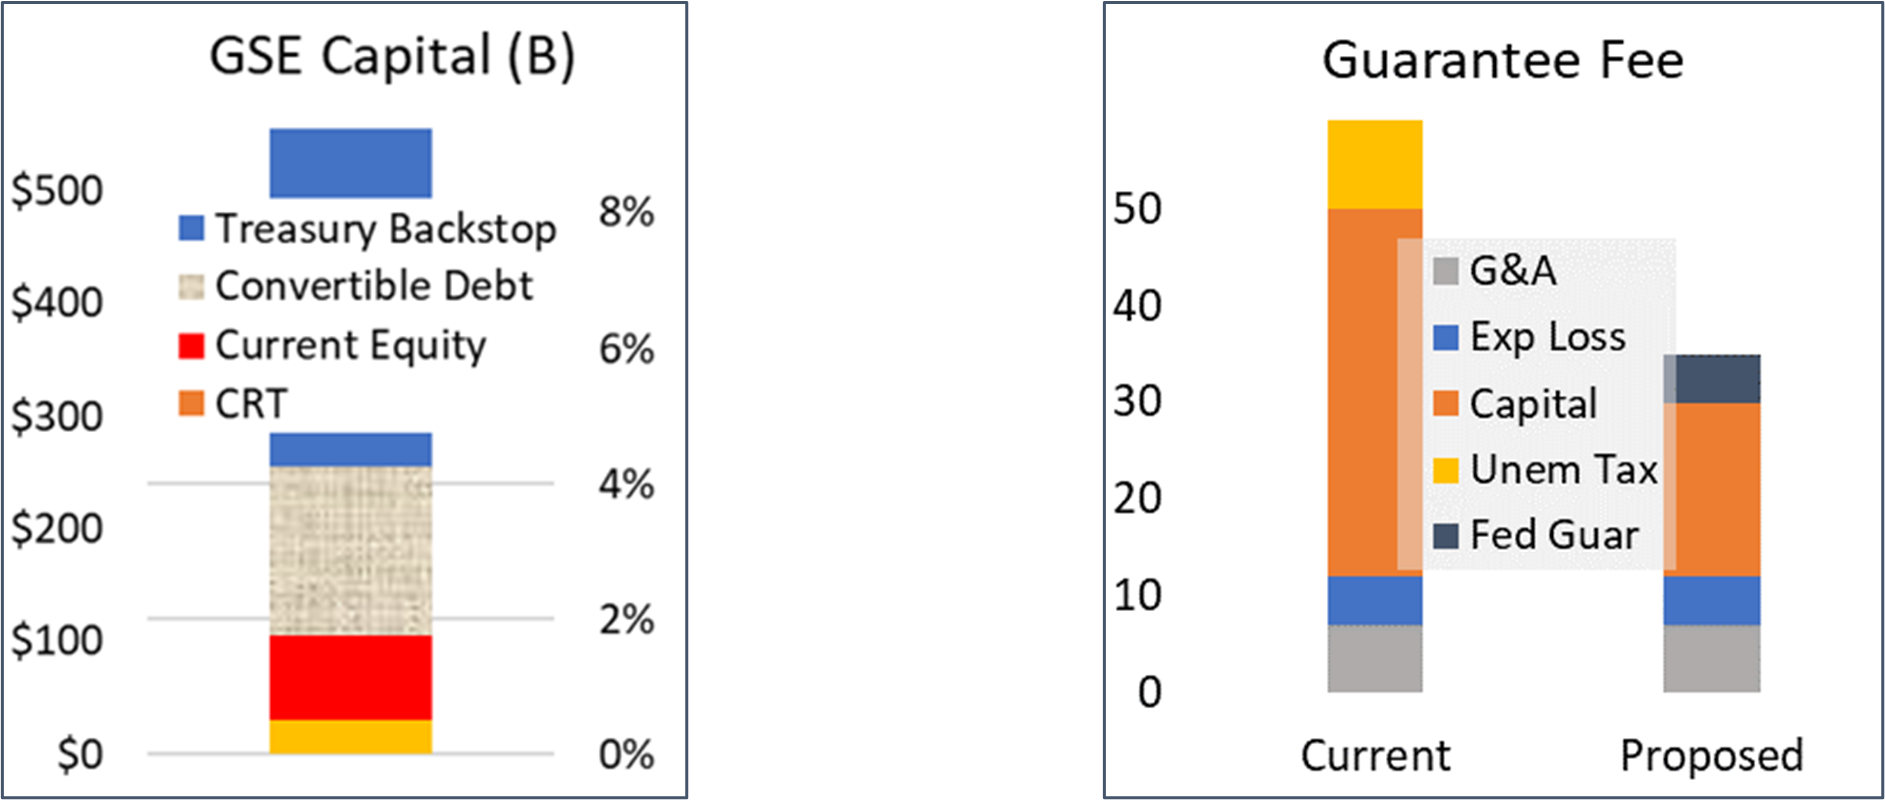
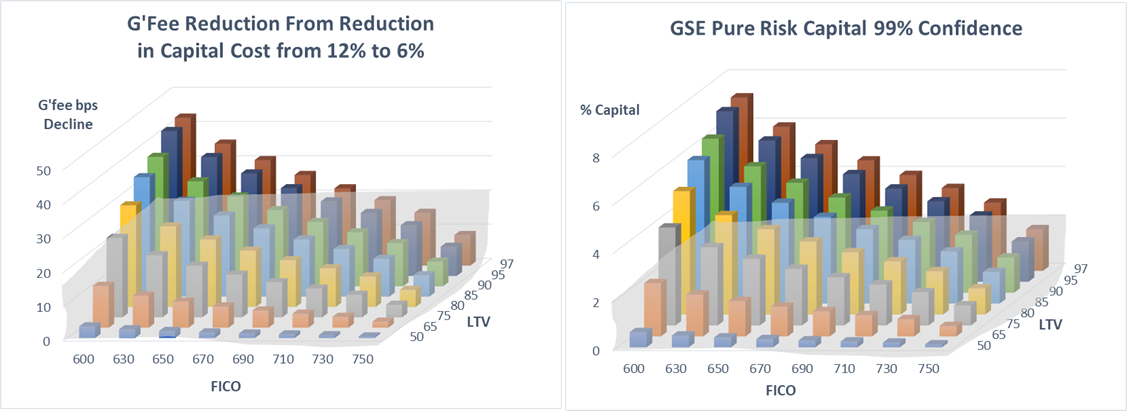
This proposal lowers average guarantee fees about 15 bps (from 50 to 35), but the GSEs necessarily vary price with risk through LLPAs with a low baseline fee of 15 bps. The graphs below show the impact on pure risk capital (absent the buffer) and in guarantee fee equivalents from the current LLPAs to a 6% COF (cost of funds). Lowest risk loans have vanishingly small reductions while loans with FICO < 700 and LTV >= 90 would have fee reductions of 20 to 40 bps. This result is achieved by using private market capital costs and securitization, taking the guesswork out of choosing the funding cost.
ConclusionFHFA could authorize the GSEs to issue unguaranteed enterprise debt to replace shadow capital and thereby reduce the uncertainty around capital costs by using actual debt costs. This could also lower guarantee fees in proportion to the risk, benefitting borrowers with lower wealth and income. Many details would have to be worked out, but this discussion lays out a way forward.
[1] A Missing Piece of the Administrative Reform Puzzle: How the GSEs Generate Cross-Subsidies
The S-Curve Archives
-
 Events
The Structured Finance Association hosted SFVegas 2023 (February 26 - March 1), a broad capital markets conference with thousands of attendees in Las Vegas. Andrew Davidson & Co. Inc. (AD&Co) was a sponsor focused on the mortgage sector. As we engaged with clients and policy leaders, a few themes emerged: Data, Expanding Access Safely, Ginnie Mae Servicing and Auto Loan Performance.
-
 Products
Andrew Davidson & Co., Inc (AD&Co) is pleased to announce the official release of the LoanDynamics Module in Kinetics, AD&Co's new modular platform for running AD&Co analytics via a desktop application, web browser, or REST API. The LoanDynamics Module is the latest way to run the LoanDynamics Model, allowing users to perform sensitivity analysis, validation testing, and scenario analysis in a modern, user-friendly application.
-
 Thoughts
Recently the Federal Housing Finance Agency (FHFA) announced some upcoming changes related to the use of new credit scores, FICO 10T and VantageScore 4.0 by Fannie Mae and Freddie Mac. “FHFA expects that implementation of FICO 10T and VantageScore 4.0 will be a multiyear effort. Once implemented, lenders will be required to deliver both FICO 10T and VantageScore 4.0 credit scores with each loan sold to the Enterprises”.[1] This announcement will impact the entire mortgage ecosystem.
-
 Thoughts
January is National Mentoring Month which is very appropriate since it coincides with the time when we typically set out our goals and intentions for the New Year. Organizations are embracing mentoring programs and these programs have indeed become a strategic imperative for many. There are many benefits to mentorship and it's easy enough to comprehend. The individuals involved in a mentoring relationship and the organizations that choose to sponsor a mentoring program all are likely to benefit.
-
 Thoughts
Homeownership is the largest source of wealth accumulation and inter-generational wealth transfer for the working and middle class. However, the history of racial discrimination (it was actually legal to discriminate by race in housing until the Fair Housing Act of 1968), suggests that we have a continuing responsibility to ensure fair access to housing and housing finance.
-
 Thoughts
Dear Friends,
As Andrew Davidson & Co., Inc. (AD&Co) reaches its 30-year milestone, I reflect on two seemingly contradictory ideas: Firms need experience to guide clients through difficult times but sometimes it is necessary to discard past practices to achieve breakthroughs.
-
 Thoughts
For many people, having accessible transportation (a car, for example) is necessary. Most U.S. people live in areas without adequate public transportation and require vehicles to access jobs, healthcare, and groceries.
-
Thoughts
As interest rates rise and fewer loans with refinancing incentive remain, other factors are primed to play a larger role in determining prepayment speeds in the coming months (and perhaps years). Turnover, the rate at which people move, is the most cited of these factors. In this blog post, we’ll consider two other potential drivers: curtailments, or partial prepayments, and mortgage payoffs that don’t involve taking out a new loan.
-
Thoughts
Summary
In 2021, Andrew Davidson & Co. Inc. (AD&Co) proposed a benchmark cohort approach to setting Ability-to-Repay (ATR) Qualified Mortgages (QM) standards. Successful benchmarks based on data are model-free and transparent, and the cohorts must perform consistently in comparison to one another and across time. Our original work used data through the early stages of the pandemic when non-performing loan percentages skyrocketed.
-
 Thoughts
How Lowering Capital Costs Affects Higher-Risk Loans
Government-sponsored enterprises (or GSEs) are companies that provide guarantees and financing to originators through the mortgage secondary market. The size and resilience of the GSE secondary market maximizes diversification and liquidity which reduces financial risk and cost of capital. This benefit accrues to conforming borrowers through lower mortgage rates and resiliently available financing.