

Welcome to The S-Curve
Now you will be able to receive the latest announcements, product updates, and our insights on the mortgage market in real time.
The name of the blog, the S-Curve, is a reflection of our logo and the central feature of our prepayment model. S-curves are seen in nature in many phenomenon, from population growth to prepayment and default models. Our first S-curve, in the early 1990s, used the arctangent function, then piece-wise linear functions, and evolved over time to be more complex and vary by FICO, loan size and LTV. This evolution encapsulates both the timeless nature of fundamental relationships and constant innovation to describe them better over time.
We hope you find the information useful and we look forward to your feedback.
-
Industry Leaders in Fixed-Income Analytics, Kelli Sayres and Gene Park, join Andrew Davidson & Co., Inc.News
We’re excited to announce a major addition to the Andrew Davidson & Co., Inc. (AD&Co) team. Industry leaders Kelli Sayres and Gene Park, known for building and scaling leading fixed-income analytics platforms, have joined AD&Co’s Business Development team. With decades of experience, deep client partnerships, and a shared commitment to rigorous quantitative analytics, their arrival marks an exciting new chapter for our firm and the clients we serve.
Read the full press release to learn more about their backgrounds, recent work at Numerix, formerly known as PolyPaths and what this means for AD&Co.
-
 White Paper: Evaluating GSE Servicing Rights With Extended Consumer Credit Data: Valuation and Sensitivity AnalysisThoughts
Building on our earlier research on expanded consumer attributes, AD&Co continues to explore how credit data contributes to modeling delinquency and prepayment risk, which are key drivers of mortgage servicing rights cash flows and valuation.
Our latest analysis shows that while modern credit scores capture important borrower behavior, there is still meaningful explanatory power beyond any single score. Across 2,000+ consumer attributes, additional variables provide incremental insight into loan performance and mortgage servicing rights valuation dynamics.
Read Now
-
 Andrew Davidson Featured on the One On One with Greg SherEvents
Andrew Davidson recently joined NFM Lending’s Greg Sher on the One On One podcast to discuss our recent white paper, “The Impact of Moving Away From the Tri-Merge Standard.”
In the conversation, Andrew shares insights on the evolving credit score landscape and what these changes could mean for mortgage modeling and risk assessment.
You can listen to the full discussion here:
-
 Impressions from SFVegas and OB Summit 2026Events
AD&Co recently sponsored and attended SFVegas 2026 and Optimal Blue Summit 2026. This post shares the AD&Co team's unique perspectives and key takeaways from attending both conferences.
The New Non-Agency Model, Real Estate Exposure to Climate-Related Hazards & Escrow Analysis (Eknath Belbase)
Daniel and I recorded a Exchange Live: Tech Odyssey podcast on Kinetics and the upcoming release of LDM v4.0. The 30-minute audio and accompanying slides are available on demand. We focused on DSCR/prepay penalty, along with the addition of climate.
My panel on climate risk and property values went well – this year the focus shifted a bit to resilience, and the opportunity to reduce the rate of insurance increases by putting money up front into strengthening homes. Several states are funding the initial outlay required in pilot programs as part of insurance affordability initiatives (including Deep South states). David Zhang of MSCI started off the discussion with a tally of damages from physical risk sorted into quintiles of cost (measured against home value). The top quintile is already at a mean of 55bps per year of loss (these are only losses from weather events of scale and insurance needs to include costs such as fires starting from appliances or flooding from sewer back-ups).
Finally, we learned that Cotality has a database of property tax histories on all U.S. single-family homes and is working on an approach to forecast taxes going forward, so our vision of a full escrow-conditioned HPA and LDM is within reach.
Contact us for more information on LDM v4.0.
Key Takeaways (Daniel Swanson)
It was great to see so many familiar faces and to see the conference booming (though also a bit foreboding – the last time it was so packed, there was a crisis shortly thereafter). Here are a few key takeaways I had from talking to different people.
Non-QM
- There is a lot of interest in non-QM from many sophisticated participants
- Analyzing new loans is complicated and most people are not taking advantage of all the information in the deals
Climate
- State-level behavior is changing, particularly FL payups, perhaps due to taxes and insurance (that link is hard to prove)
- Servicers are starting to care about T+I for several different reasons (escrow float=positive, delinquency risk=negative)
Credit Scores
- Participants are mostly worried about disruption to their process when thinking about credit scores rather than performance
AI
- Everyone is thinking about AI, whether they are talking about it or not (and there are plenty of people talking about it)
How AD&Co and Optimal Blue Are Transforming Pipeline Risk Management for Loan Originators (Yvonne Chen)
At the Optimal Blue Summit 2026, we connected with loan originators and our alliance partners at Optimal Blue to discuss the evolving challenges in the mortgage origination sector. The conversations and conference sessions reinforced the patterns we've been seeing: Origination is a thin margin business, and originators must carefully manage the uncertainty and financial risks from locking rates at the beginning of the application process through to loan sale. Lenders manage their pipelines across agency and non-agency loan products while simultaneously borrowing closing funds and hedging to protect their profit margins – all while contending with interest rate volatility, fallout risk, basis risk in non-QM products, and borrower renegotiation. Fallout rates have climbed in recent years as borrower behavior shifts and competition intensifies in a low-volume market, making accurate pipeline risk management more critical than ever. Optimal Blue and AD&Co see the persistent need for the kind of sophisticated analytics that we can provide to help lenders stay ahead of these challenges.
AD&Co was featured on a panel where Matteo Caracciolo-King had the chance to present a first look at our insights on consumer behavior in the application process based on Optimal Blue’s national application data set. Originators were keenly interested in forecasting application stage transition probabilities, which vary over time and across interest rates, as well as the kind of financial risk metrics that AD&Co can provide. The conference confirmed our view that, as pipeline hedging grows more complex, particularly with a fast-growing non-agency market, we see a meaningful opportunity to help originators strengthen their risk management through advanced analytics integrated into the Optimal Blue platform they already rely on.
-
 FRED Adds AD&Co’s GSE-and-Borrower-Option-Adjusted Spreads for CRT IndicesNews
AD&Co US Mortgage High Yield Indices
The Federal Reserve Economic Data (FRED) portal, housed by the Federal Reserve Bank of St. Louis, has been publishing AD&Co’s CRT indices since 2019. These series posted under the overall name of “US Mortgage High-Yield” include total return rates and credit and option-adjusted spreads (crOAS) – a projected return’s spread over Treasury (in the past, Libor). These series are available going back to 2014-end and tiered by CRT initial supports.
Tier 0 includes all CRTs with under-25 bps support; Tier 1 bonds have supports exceeding 25 bps, but not 95 bps; Tier 2 has support from 95 bps to 175 bps; Tier 3 – from 175 bps to 375 bps, and, finally, Tier 4 – above 375 bps. The actual bond’s name (As, Ms, or Bs) that matches each tier can vary over time and between Fannie Mae’s CAS and Freddie Mac’s STACR transactions. We define Mid-Tier as the aggregation of Tiers 1 through 3. A CRT to be included in an index must have a factor of 0.25 or higher.
While actual rates of investment return are computed model-free, crOAS levels come from the AD&Co model. Importantly, the crOAS indices that date back to 2014 do not account for the GSE call option embedded in a CRT and therefore overstate the expected return. See, for example, index CROASMIDTIER for Mid-Tier or index CROASTIER0 for Tier 0; the latter currently shows crOAS of about 600 bps.
What is New?
Over the last couple of years, AD&Co developed a model to account for embedded GSE calls. Most CRTs are now issued with a five-year call and a cleanup call. Exercised in the interest of the GSEs, those options reduce investor return. Our December 2024 Quantitative Perspectives[1] laid out the theoretical foundation of our methods. A subsequent September 2025 Pipeline article[2] listed results of the production analysis across the entire CRT cash market.
We have been using the new method in our CRT Monitor monthly publication for the last several months. We have also started sending the new series to FRED, which has adopted it with an announcement. The new crOAS series goes back only to June 30, 2025, and is reported by the same tiers as the previously computed ones. To indicate the difference in the series, the new series contains “GSE and Borrower Options-Adjusted Spread” in the names. A screenshot of FRED’s onboarding, showing all the indices together, is seen below.
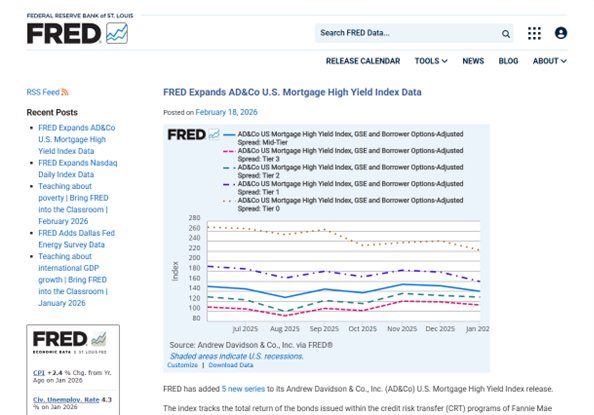
Source: FRED As expected, the more protected CRTs are priced at tighter, more realistic, crOAS levels. They never reach many hundreds of basis points when the GSE option is accounted for.
[1] A. Levin and N. Salwen, Valuation of Credit Risk Transfer with Embedded Calls, Quantitative Perspectives, Dec 2024.
[2] A. Levin, Comparative Valuation of CRTs with and without Embedded GSE Calls, Pipeline 191, Sep 2025.
The S-Curve Archives
-
News
We proudly launched our new website on November 13th. As you familiarize yourself with the new look of ad-co.com, you will come to know the many new offerings we provide. Along with the new website, we have organized our products as a menu of models and applications for a wide range of investor appetites. Let us review the menu of our product offerings.
-
News
Andrew Davidson & Co., Inc. (AD&Co), is proud to support Fite Analytics’ innovative cloud-native Mortgage-Backed Securities Analytics Service. The Fite Analytics solution incorporates AD&Co’s LoanDynamics models that provide forecasts of voluntary prepayments, defaults and losses that drive risk analytics across the mortgage-backed securities market with comprehensive coverage.
-
News
We are thrilled to announce that Andrew Davidson & Co., Inc. has launched a new look for ad-co.com. Some of the exciting new features of this site include:
-
A dynamic homepage highlighting the firm’s latest innovations, AD&Co client benefits, announcements, and Diversity, Equity and Inclusion efforts.
-