
Welcome to The S-Curve
Now you will be able to receive the latest announcements, product updates, and our insights on the mortgage market in real time.
The name of the blog, the S-Curve, is a reflection of our logo and the central feature of our prepayment model. S-curves are seen in nature in many phenomenon, from population growth to prepayment and default models. Our first S-curve, in the early 1990s, used the arctangent function, then piece-wise linear functions, and evolved over time to be more complex and vary by FICO, loan size and LTV. This evolution encapsulates both the timeless nature of fundamental relationships and constant innovation to describe them better over time.
We hope you find the information useful and we look forward to your feedback.
-
 AD&Conversations: Trends in the Home Equity SectorPodcast
Join Rob Landauer in a conversation with Abe Martin as they discuss his recent Pipeline article, "Modeling the Balance Behavior of HELOC Borrowers." In this episode, they highlight key points from the article as he shares insights into the draw component of HELOCs and provide an update on the beta release of our much-anticipated industry HELOC model.
The S-Curve Archives
-
 Podcast
Tune in to Laura Silberg's interview with Andrew Davidson, Eknath Belbase and Alex Levin as they discuss their latest Quantitative Perspectives, our independent commentary series, titled
-
 Thoughts
As providers of mortgage models for financial institutions, Andrew Davidson & Co., Inc. (AD&Co) enables clients to validate their use of our models and offers documentation describing the conceptual framework of the models, back-testing results, and sample forecasts under a variety of economic conditions. We also work with analytics providers who have incorporated our models to ensure that the models works as intended.
-
 Thoughts
We’re excited to announce two new Quantitative Perspectives that provide in-depth insights into current market trends and advanced valuation techniques. These papers offer valuable information for mortgage market participants and those involved in credit risk transfer transactions.
-
 Events
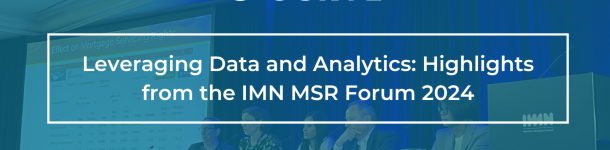
Andrew Davidson & Co. Inc. (AD&Co) proudly sponsored the Information Management Network (IMN)’s 10th Annual Mortgage Servicing Rights (MSR) Forum, held November 21 - 22, 2024 at the New York Marriott at Brooklyn Bridge.
-
Podcast
Tune in to Michelle Stepien Breier's interview with Alex Levin & Matteo Caracciolo-King as they discuss their latest Pipeline article “AD&Co Updates its Home Price Index Model.” The interview highlights key points from the article as they share recent updates to the HPI3 model.
-
 Thoughts
With the increasing volumes of Synthetic Risk Transfer (SRT) and Credit Risk Transfer (CRT) along with the discussion of BASEL III, we thought it would be useful to re-issue our comment letter to FHFA on the capital treatment of Credit Risk Transfer.
-
 Podcast
Recently, senior credit modeler, Daniel Swanson had the pleasure of speaking with Rob Kessel from the Panoramic Capital Academy podcast titled, “Modeler’s Perspective on Prepayment Modeling.” T
-
 Thoughts
The earliest paper we found examining the impact of climate risks on house prices was from 2017, which found a relationship between elevation/sea level rise and house price differences.[1]
We built our climate-conditioned HPA model in 2022 based on the idea that an increase in insurance costs would impact house prices (something we had not studied yet) in the same way that an increase of the same size in mortgage rates would impact house prices (something that we were quite familiar with).
-
 News
NewsAndrew Davidson & Co., Inc (AD&Co) is pleased to announce a new alliance with Mortgage Capital Trading, Inc. (MCT), a leading provider of mortgage capital market solutions.
-
 Events
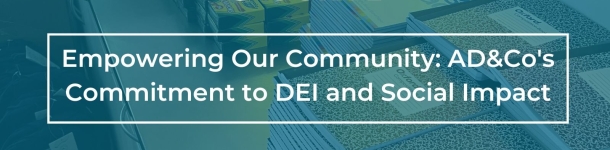
At Andrew Davidson & Co., Inc. (AD&Co), our dedication to Diversity, Equity, and Inclusion (DEI) has been a cornerstone of our values. We established our DEI Committee in 2020, following the tragic murder of George Floyd. Despite the evolving landscape, including the recent U.S. Supreme Court decision impacting affirmative action in higher education, we remain steadfast in our commitment to fostering an inclusive environment that strengthens both our employees and the company.